|
|
|

 Critical thinking involves analysis in which the nurse examines patient data available from a variet
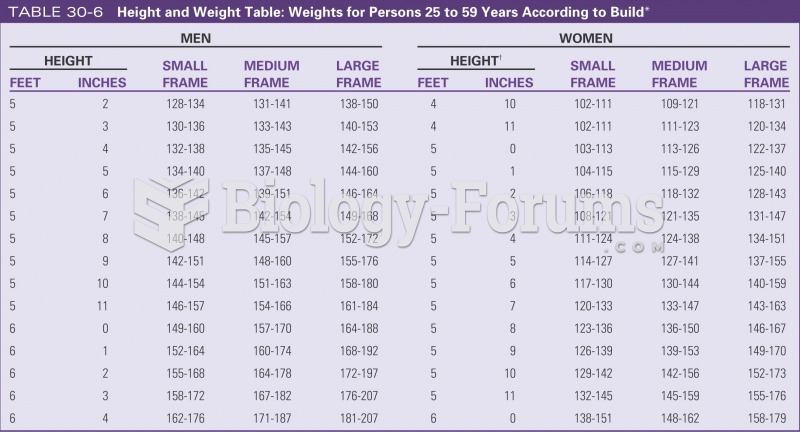 Height and weight table
 Dewey and the reformers attacked classes, such as this one, circa 1900, where students sat up straig
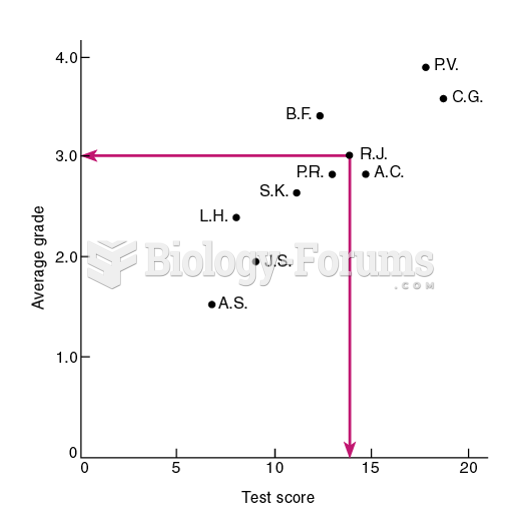 A Scatterplot of the Test Scores and Average Grades of 10 Students
 Demographic Data for Nigeria
 Find a quadractic equation that models the data in standard form