|
|
|

 How people use space as they interact is studied by sociologists who have a microsociological focus. ...
 Community colleges have opened higher education to millions of students who would not otherwise have ...
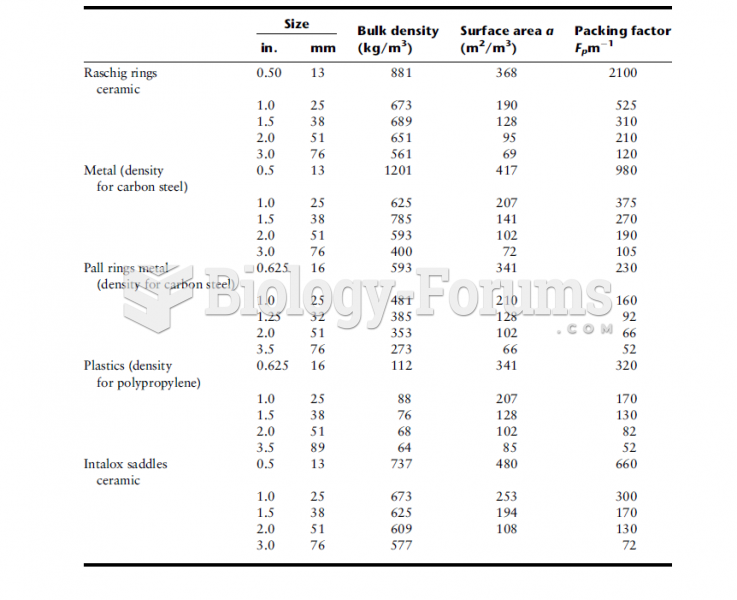 Design Data for Various Packings
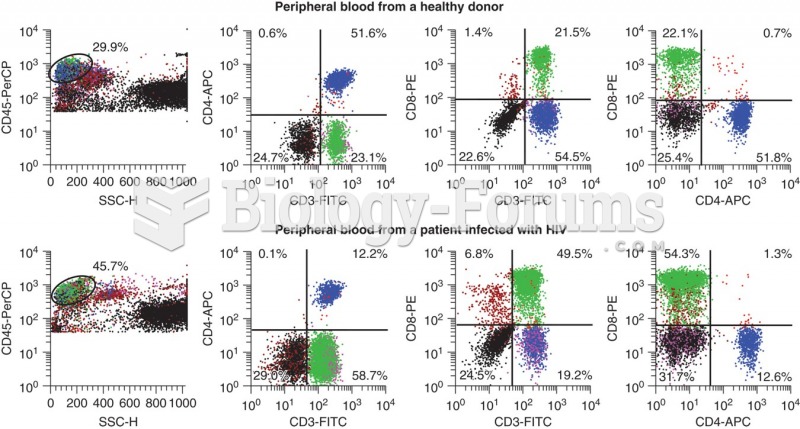 Flow data for a healthy donor (top panel) and a HIV positive patient. CD3 is a T-cell marker, CD4 is ...
 List transformations and Create a table of values for the following log function:
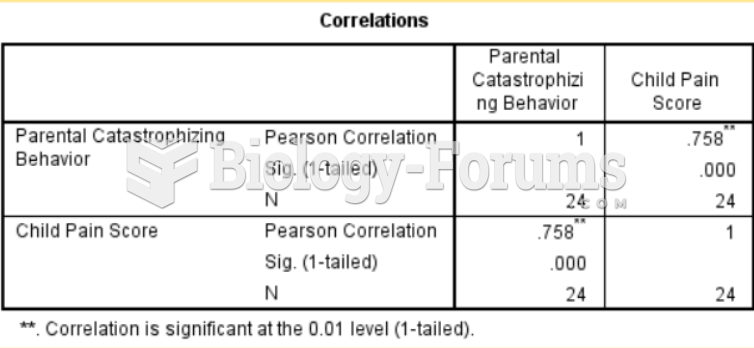 Table - Analysis