|
|
|

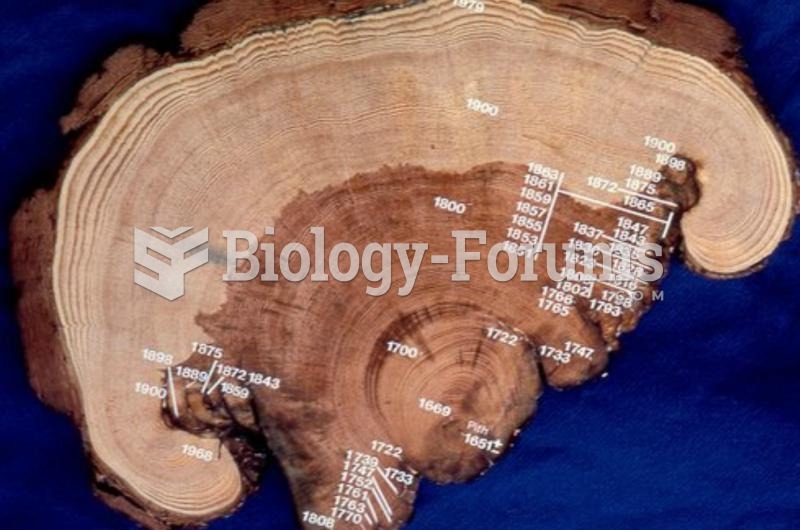 tree-ring data
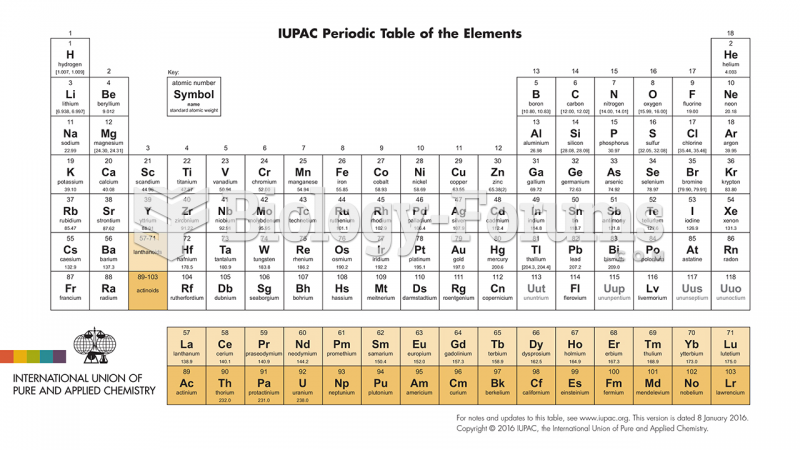 Newest Periodic Table
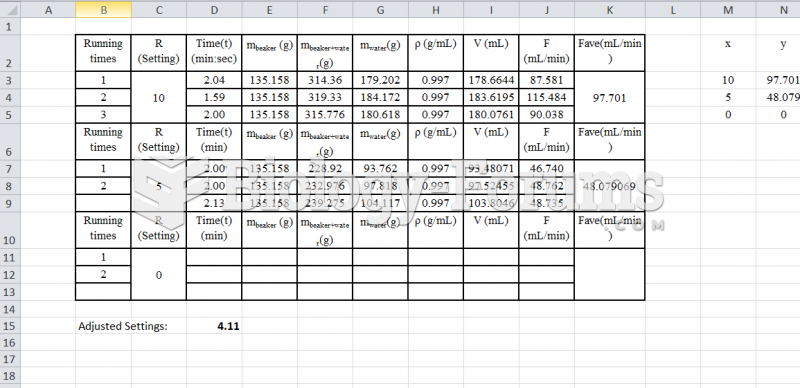 Fluidization - Calibration Table Pump #2
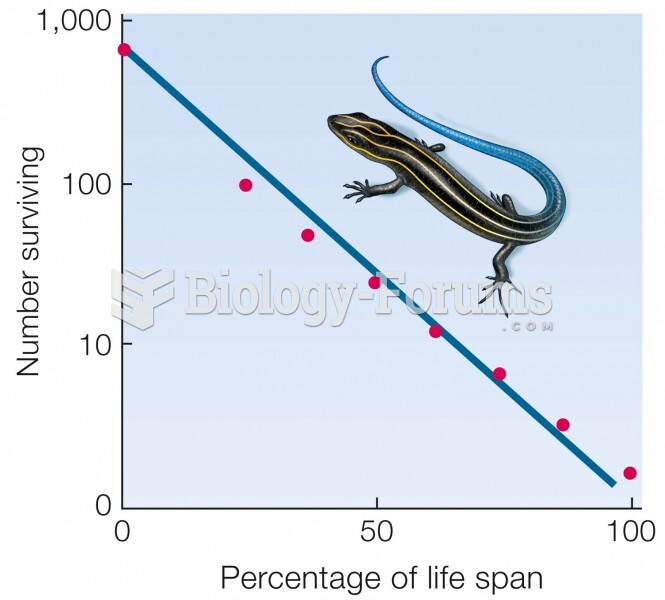 Type II curve. Mortality does not vary with age. Data for five-lined skink (Eumeces fasciatus).
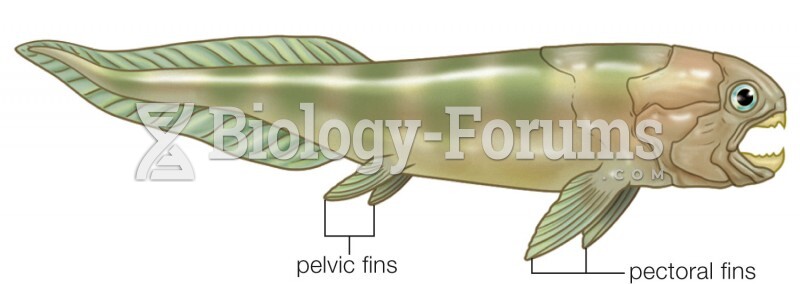 Placoderm with Paired Fins
 Sturtevant’s Recombination Data for Five X-Linked Genes in Drosophila