|
|
|

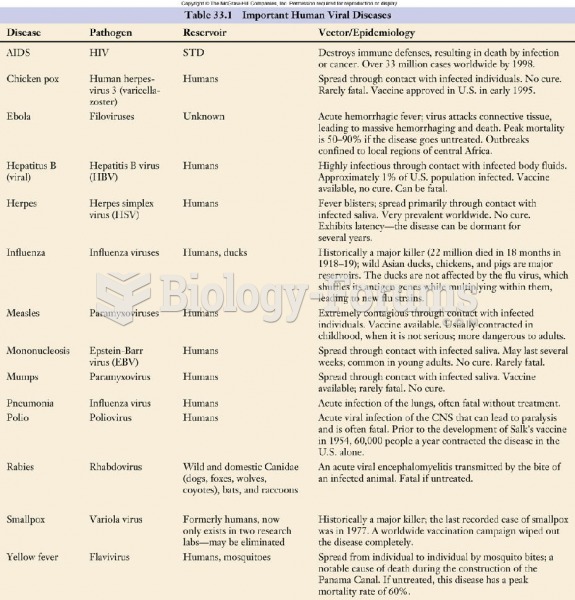 Important Human Viral Table
 Life Table
 How people use space as they interact is studied by sociologists who have a microsociological focus. ...
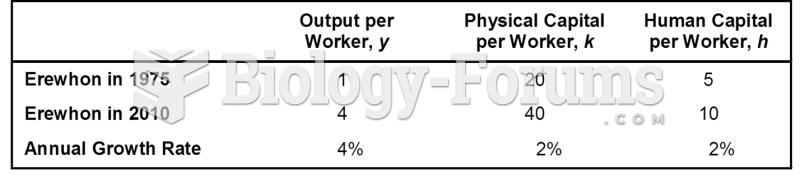 Data for Calculating Productivity Growth in Erewhon
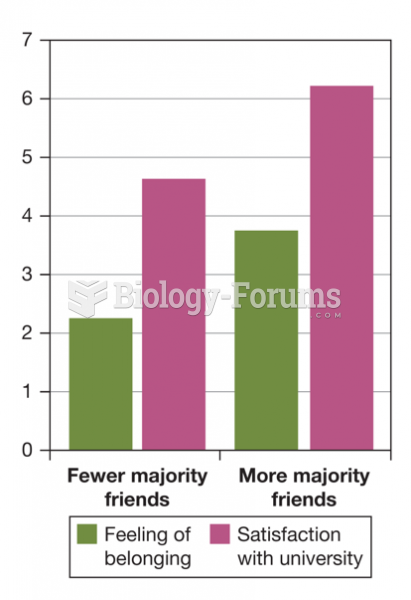 The Impact of Cross-Ethnic Friendships on Minority Students’ Well-Being
 table
table