|
|
|

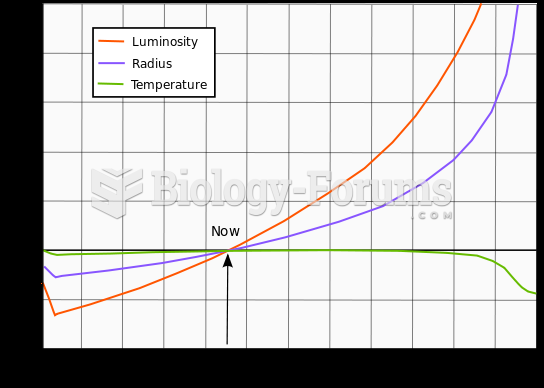 Evolution of the Sun's luminosity, radius and effective temperature compared to the present Sun
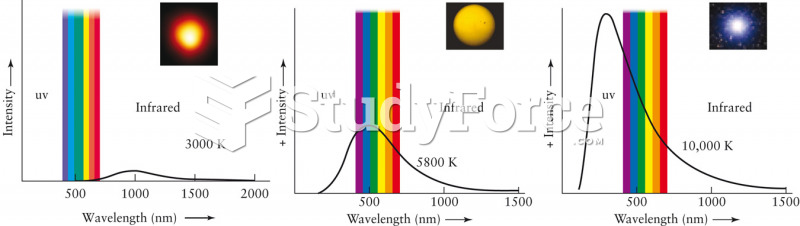 Temperature and Color
 Rub the ears between your thumbs and index fingers. Follow the curves to rub the entire ear, ...
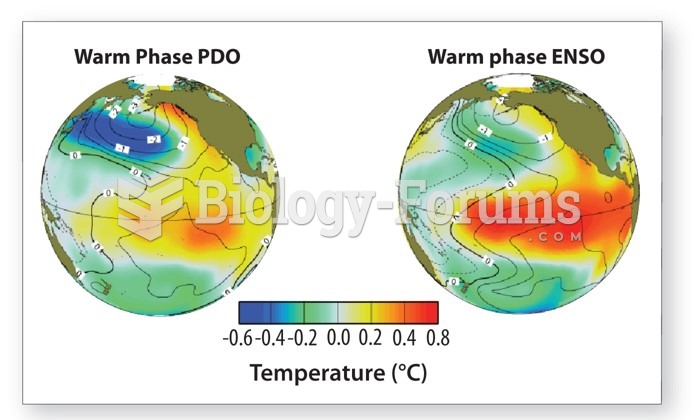 Pacific Decadal Oscillation: Temperature in degree Celsius
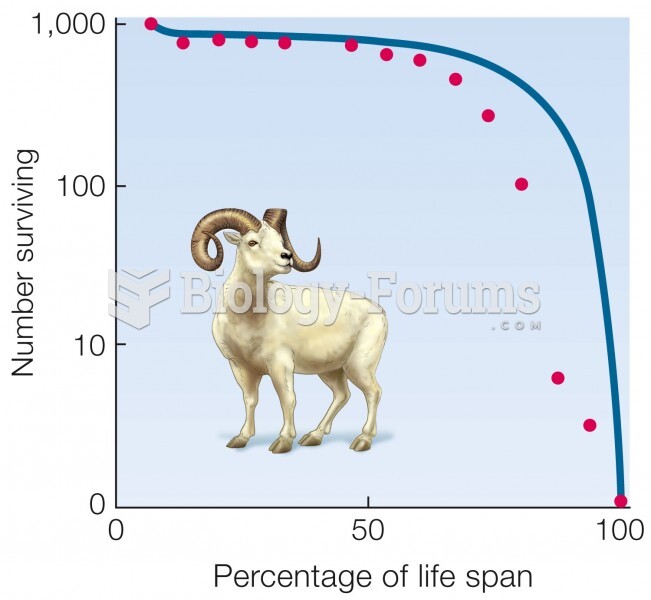 Survivorship curves.
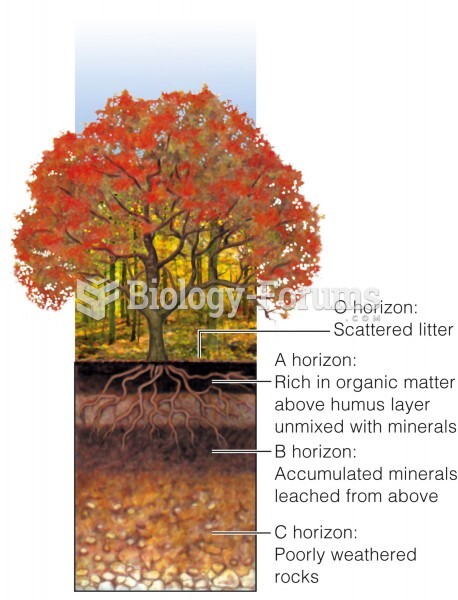 Deciduous forest soil profile