|
|
|

 Temperature and Color
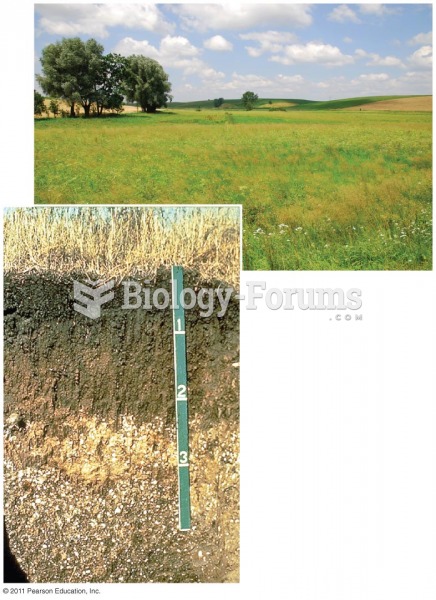 Mollisol Profile
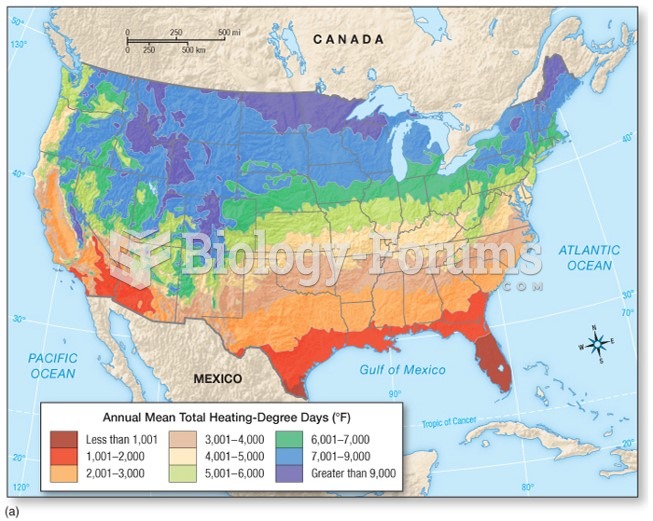 Thermodynamic Diagrams and Vertical Temperature Profiles
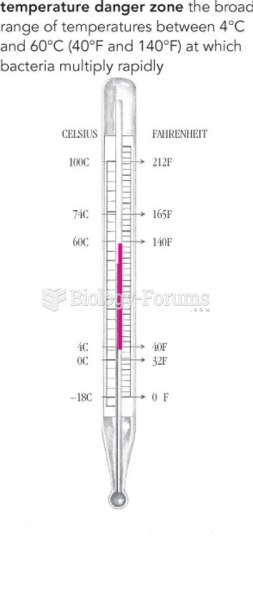 The Temperature Danger Zone
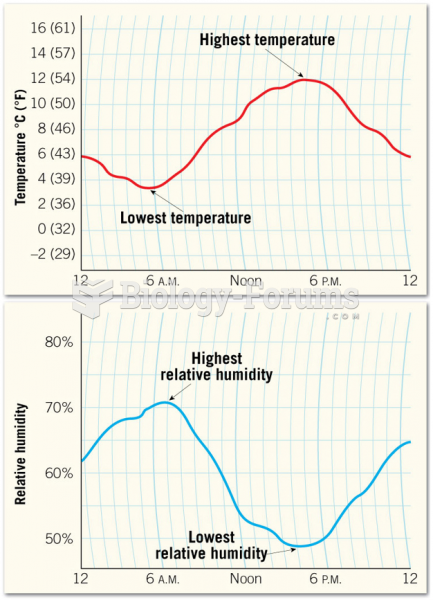 Daily Variations in Temperature and Relative Humidity
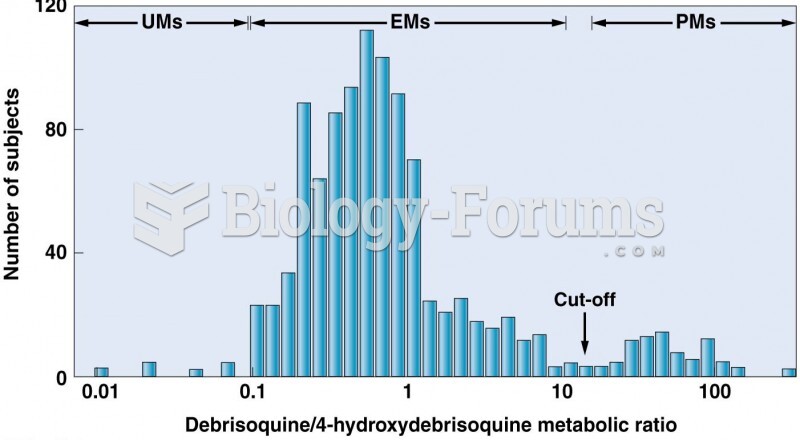 CYP2D6 pharmacogenetic profile in a Swedish population