|
|
|

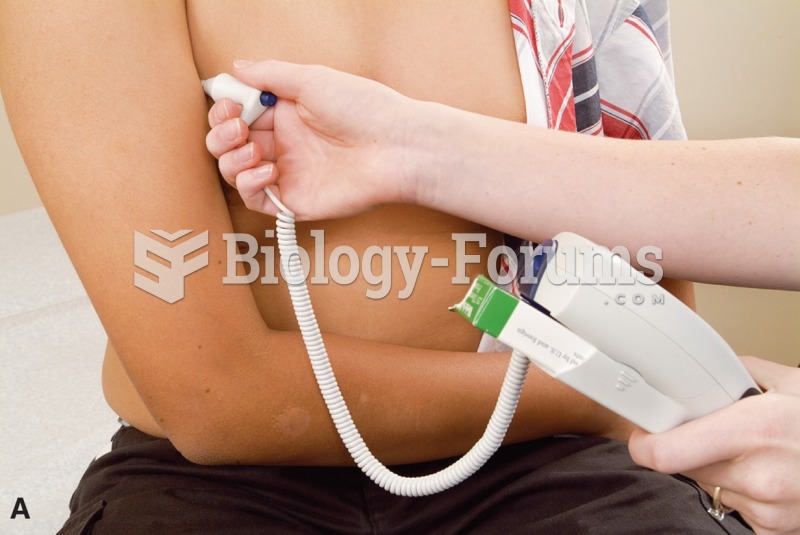 Measuring Axillary Temperature
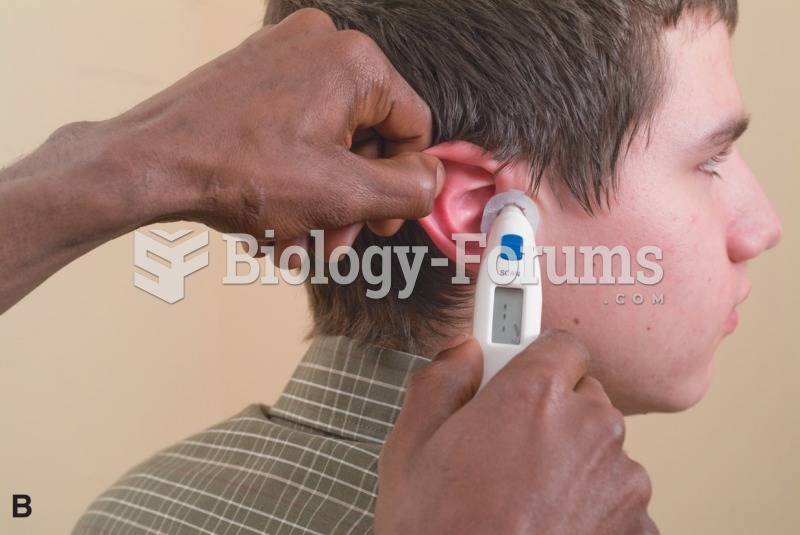 Measuring Temperature Using a Tympanic Membrane (Aural) Thermometer
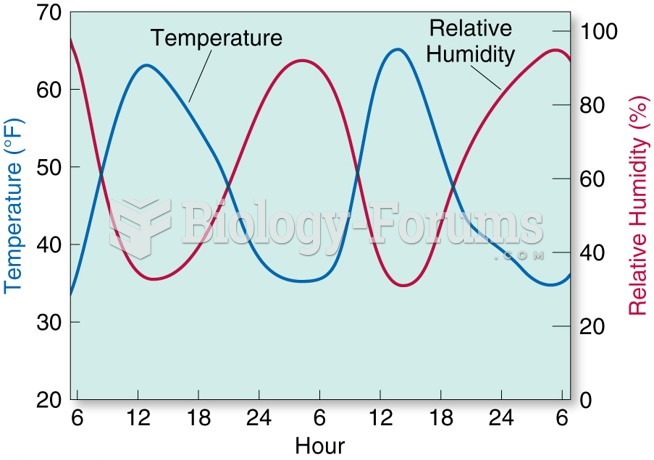 The relationship between RH and temperature.
 Adjust the water coming from the faucet so that the temperature is comfortable. Water too hot can ...
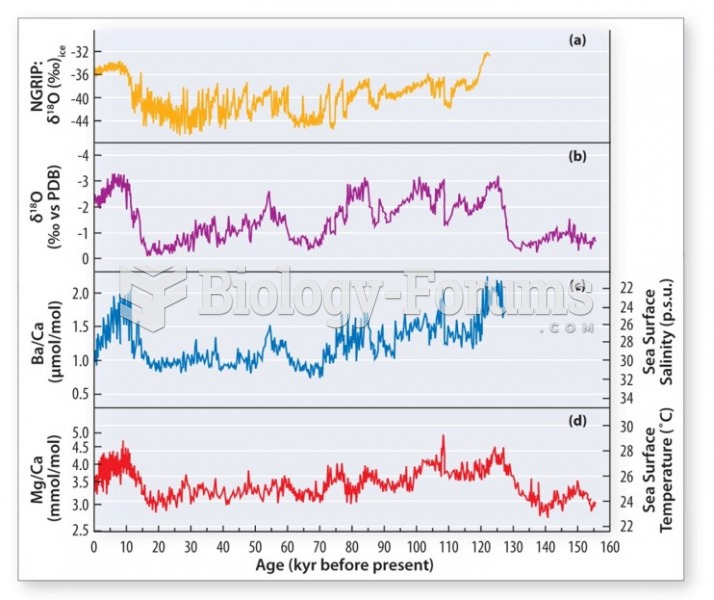 Using trace elements in carbonate shells to estimate temperature
 How much the temperature will rise depends on many factors that affect the level of GHG emission