This topic contains a solution. Click here to go to the answer
|
|
|

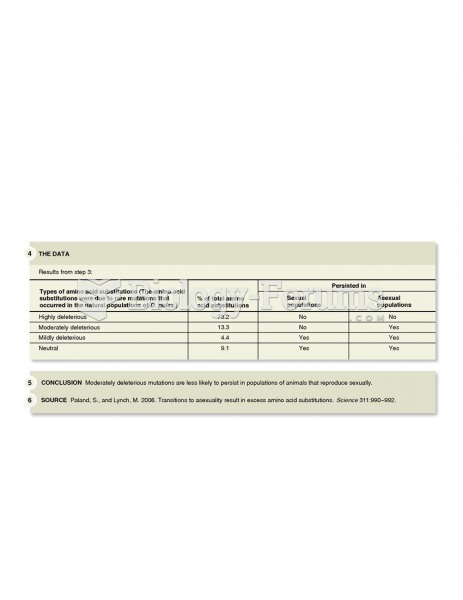 Paland and Lynch demonstrated the importance of sexual reproduction in reducing the frequency of mal
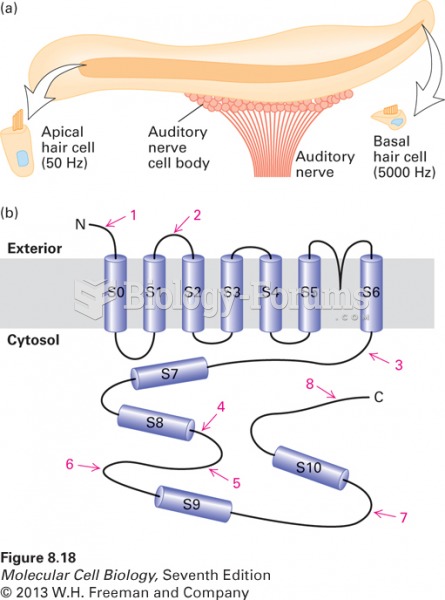 Role of alternative splicing in the perception of sounds of different frequency
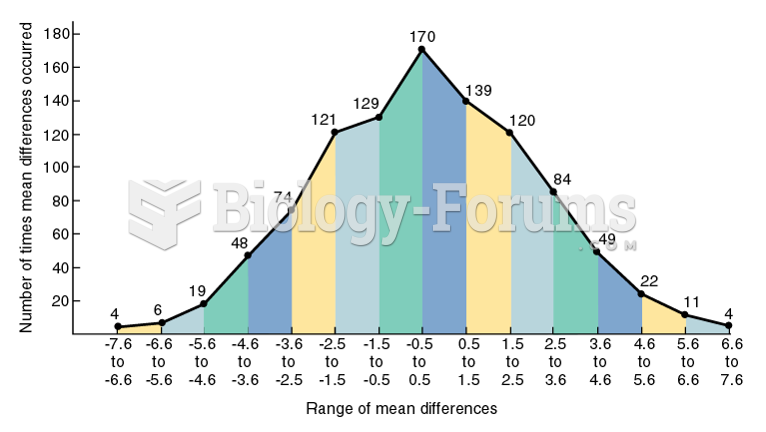 A Frequency Distribution
 The effect of selection on allele frequency
 The frequency distribution of the allele in Africa, Southern Europe, the Middle East
 The consequences of the intensity of natural selection on allele frequency.