This topic contains a solution. Click here to go to the answer
|
|
|

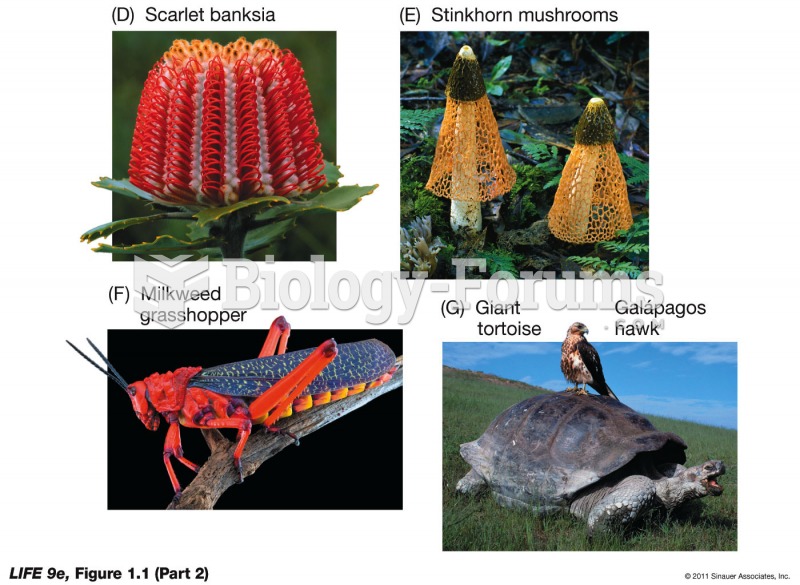 The Many Faces of Life (Part 2)
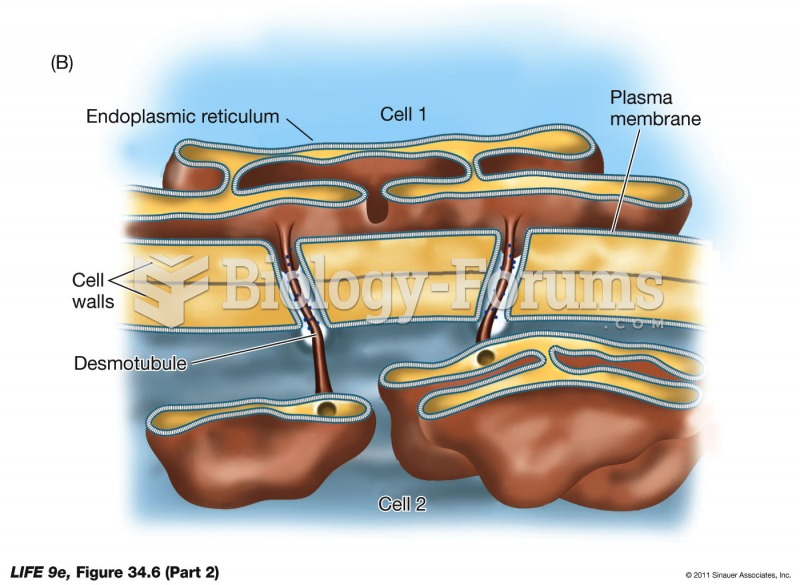 Plasmodesmata (Part 2)
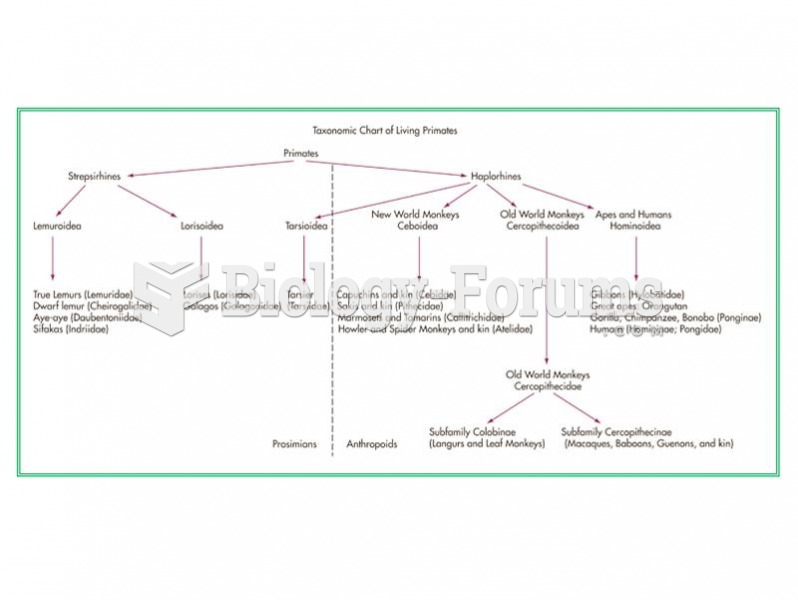 A taxonomic chart of the living primates.
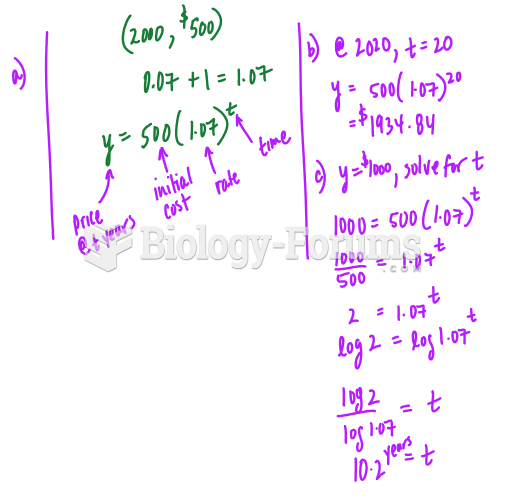 Answer the following short answer, please show your steps and include the formulas used
 A little part of textbook image
 Favourite part of school kindergarten