This topic contains a solution. Click here to go to the answer
|
|
|

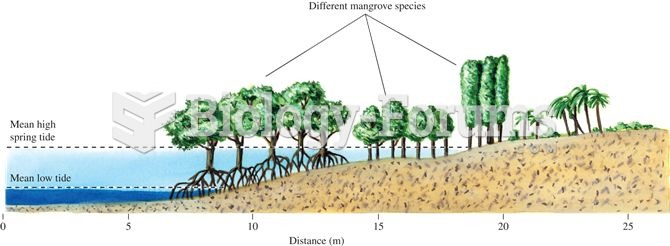 Where mangrove diversity is high, mangrove species show clear patterns of vertical zonation relative
 How to find the anti-derivative of a function (Part 3)
 How to solve for inequalities (Part 1)
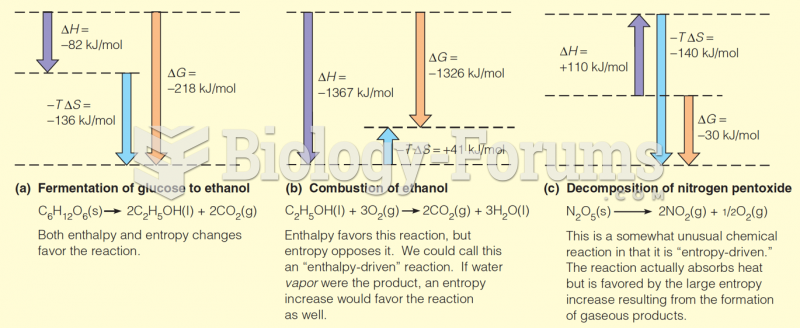 Contribution of enthalpy and entropy to several favorable processes
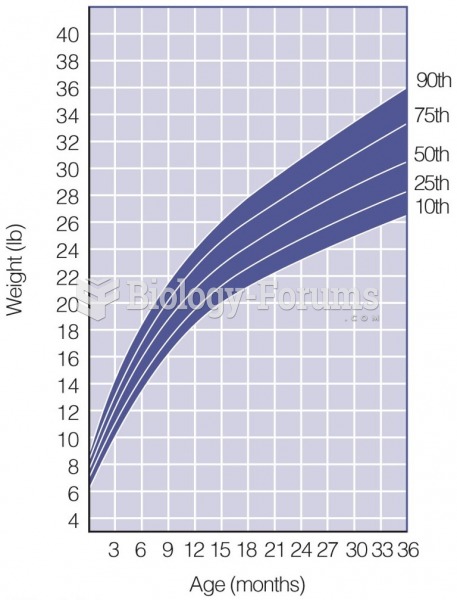 Growth Chart
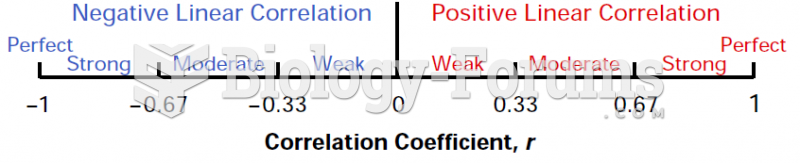 Correlation Coefficient, r (Chart)