This topic contains a solution. Click here to go to the answer
|
|
|

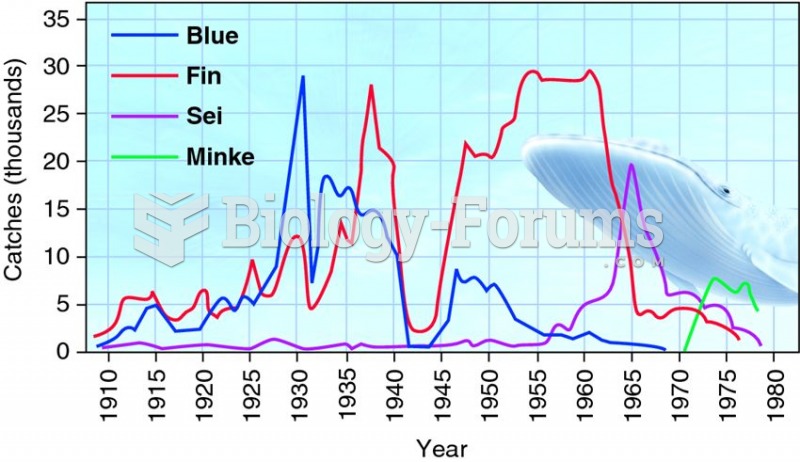 Sequential decline of whale catches in the Antarctic shows the strong effect of human predators.
 An Oil-dependent World— Supply and Demand Driven
 a) Face the direction of your stroke. b) Avoid facing away from your stroke.
 Increased neurogenesis in the dentate gyrus following damage. The left panel shows (1) an ...
 Infant formula is available in several forms and varies in cost and ingredients
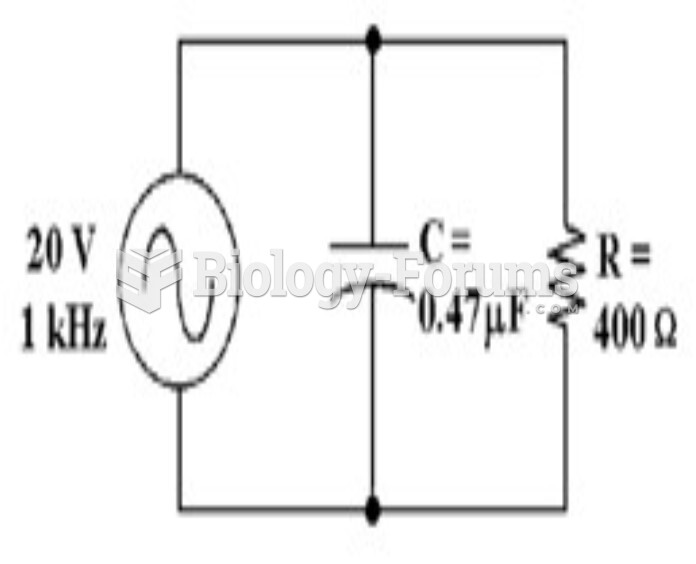 How much voltage does the resistor drop in Figure 10-2? a. 59 mV b. 19.94 V c. 20 V d. 10 V