This topic contains a solution. Click here to go to the answer
|
|
|

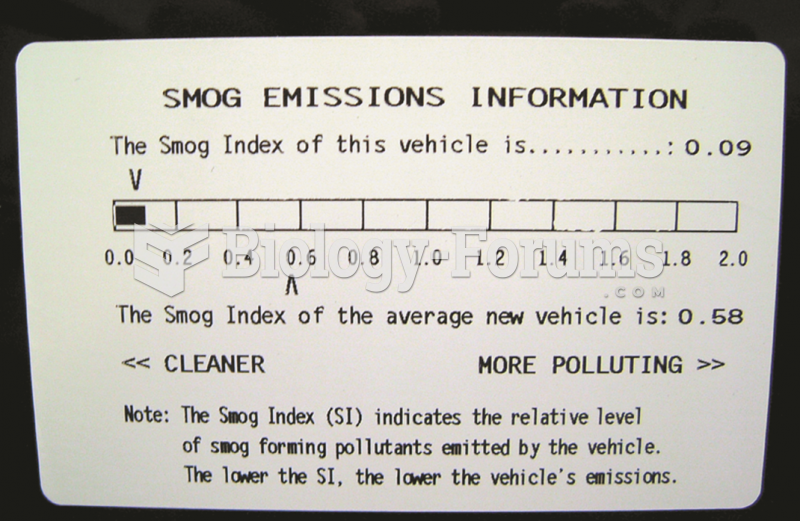 This label on a Toyota Camry hybrid shows the relative smog-producing emissions, but this does not ...
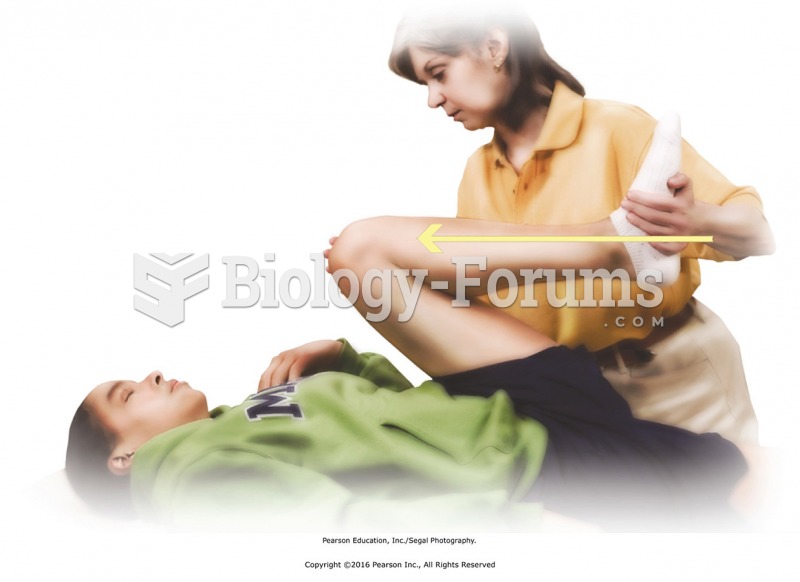 Apply knee to chest stretch for posterior hip and leg muscles. Facing the table directly, place one ...
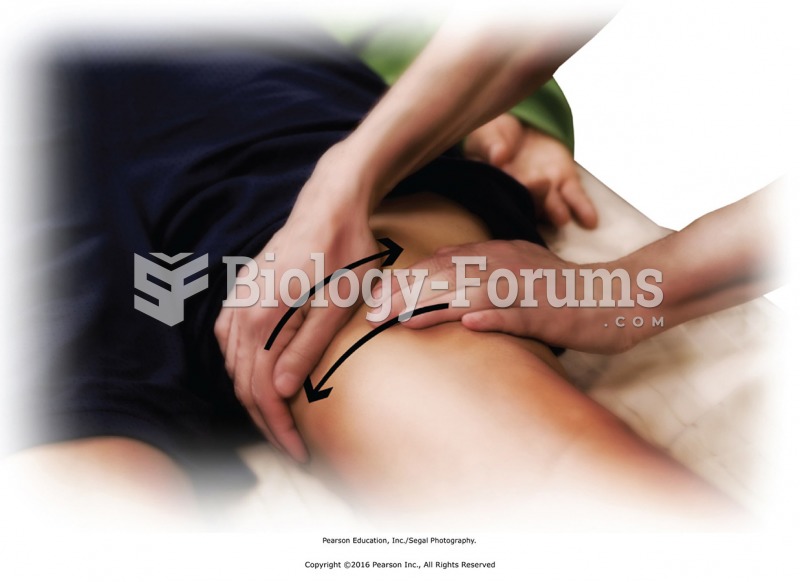 Perform horizontal stroking of the thigh by facing the table and placing hands on the thigh with ...
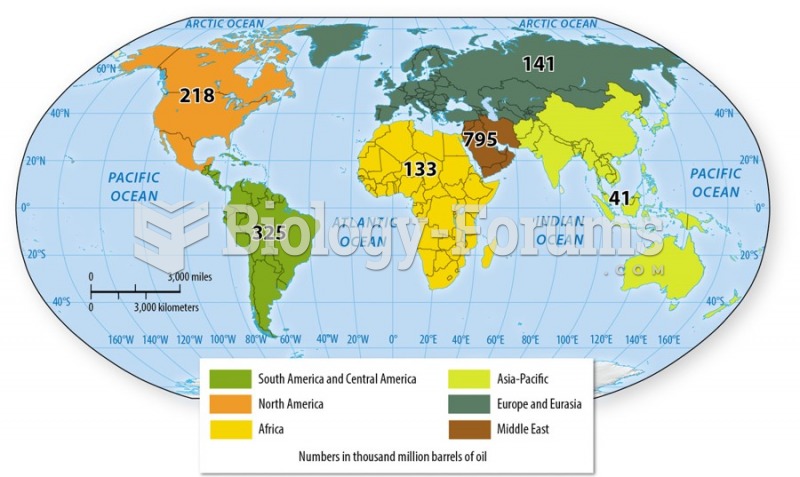 Growth in the demand for oil from the developing world
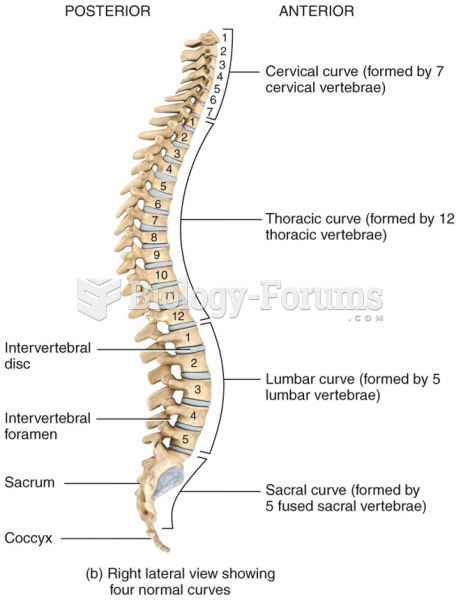 Right lateral view showing low normal curves of the vertebral column
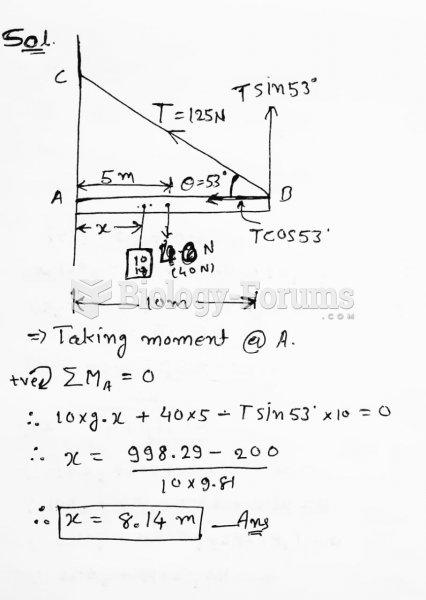 In the figure, a 10.0-m long bar is attached by a frictionless hinge to a wall and held ...