This topic contains a solution. Click here to go to the answer
|
|
|

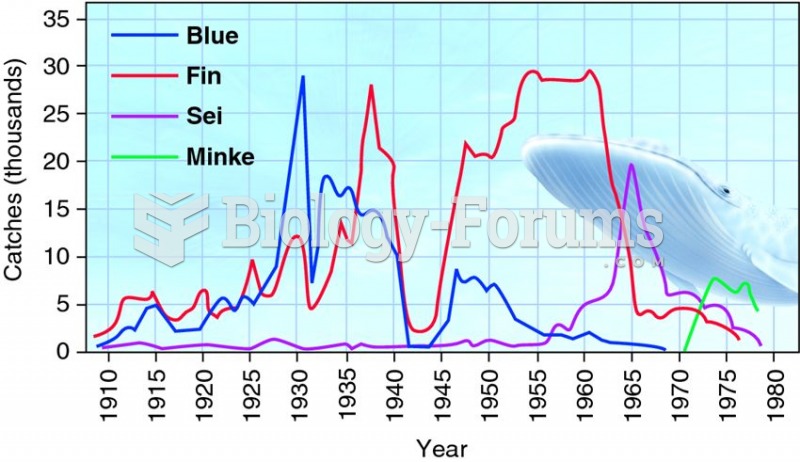 Sequential decline of whale catches in the Antarctic shows the strong effect of human predators.
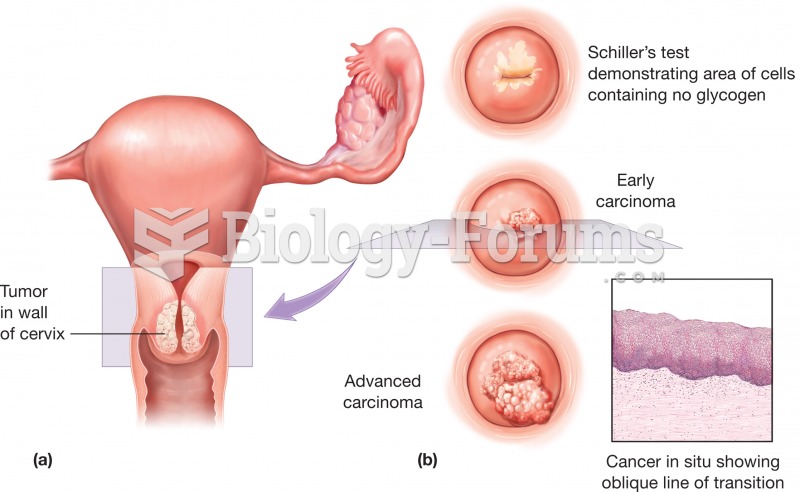 Cervical cancer (a) Top view of the uterus showing the presence of a tumor in the wall of the cervix
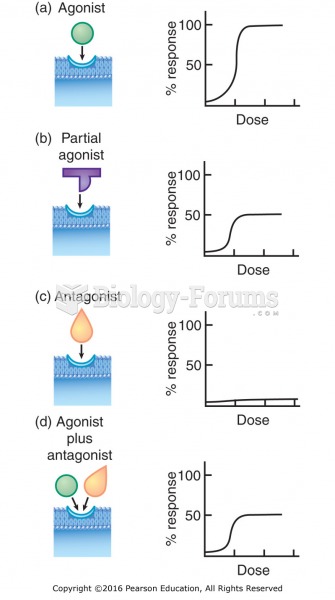 Agonists, partial agonists, and antagonists: (a) An agonist results in maximum response. (b) A ...
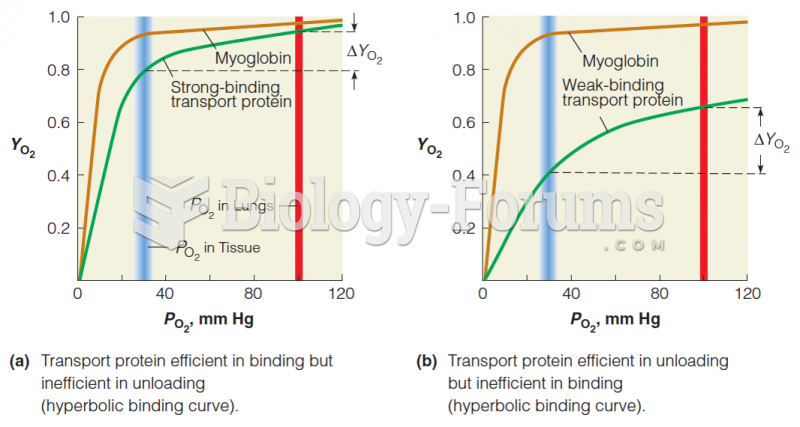 Cooperative vs. noncooperative O2-binding curves
 Human Figure
 Which of the following reactions correctly shows the transmutation of an element by neutron ...