This topic contains a solution. Click here to go to the answer
|
|
|

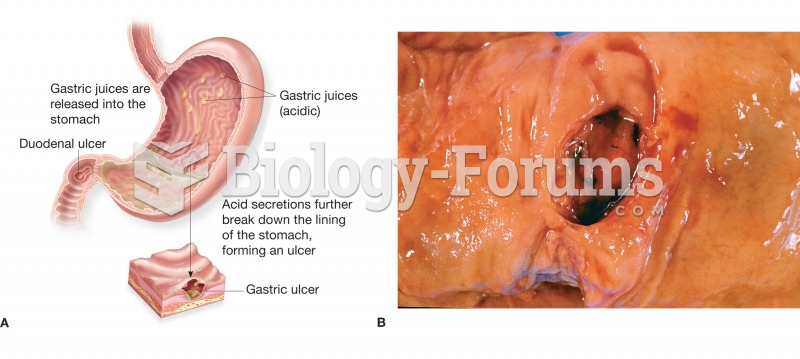 (A) Figure illustrating the location and appearance of a peptic ulcer in both the stomach and the du
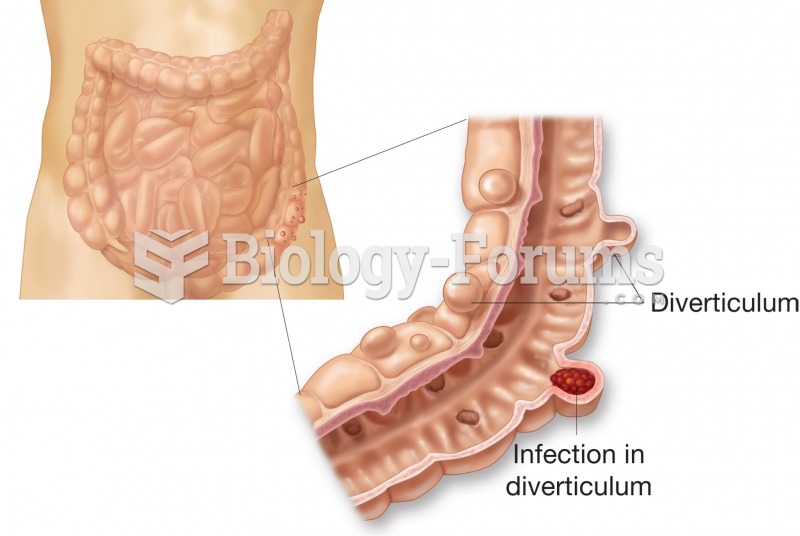 Diverticulosis. Figure illustrates external and internal appearance of diverticula.
 The Increasing Cost of Health Care, 1960–2010
 This battery shows a large “1000” on the front panel but this is the CA rating and not the ...
 Suppose a country imports televisions. The country's supply and demand curves are shown in ...
 What is the total resistance of the circuit in Figure 1? 150