|
|
|

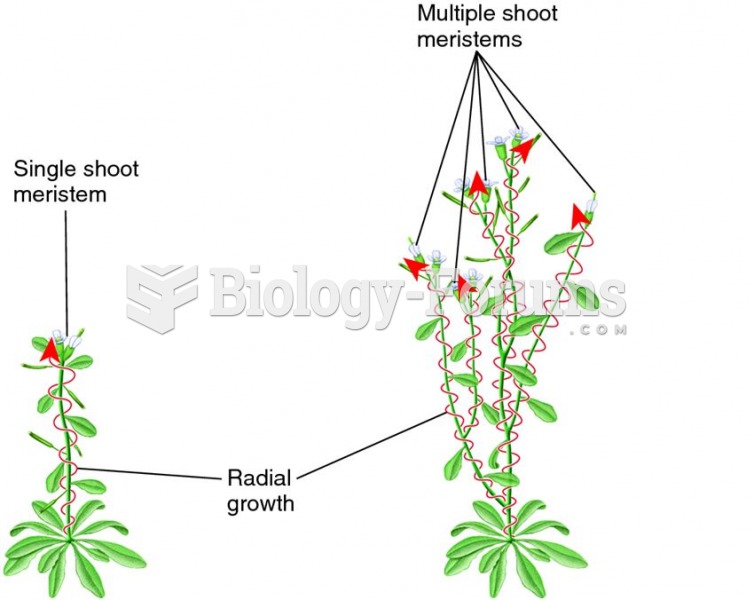 Radial pattern of shoot growth in plants
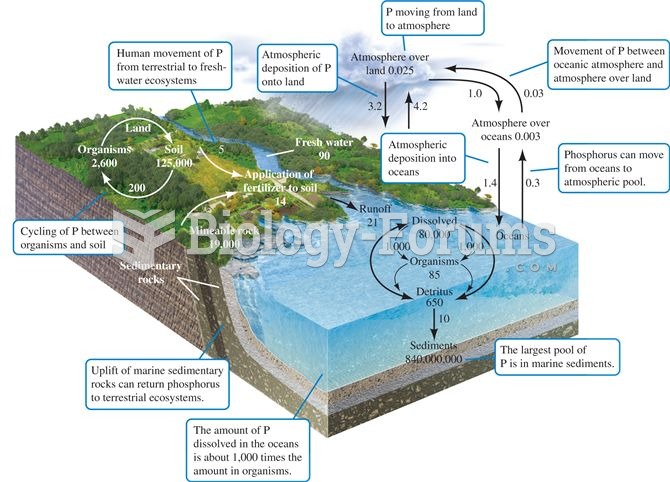 The phosphorus cycle. Numbers are 1012 g P or fluxes as 1012 g P per year (data from Schlesinger 199
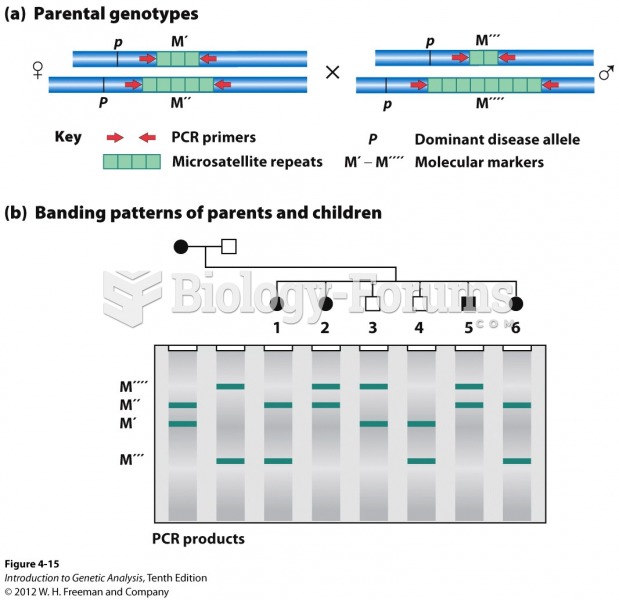 A microsatellite locus can show linkage to a disease gene
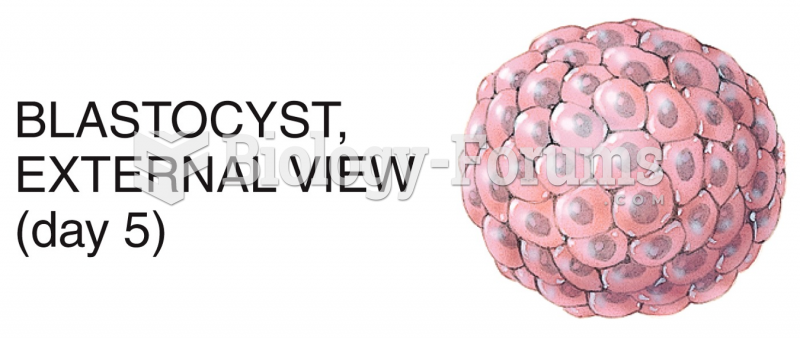 Embryonic Period
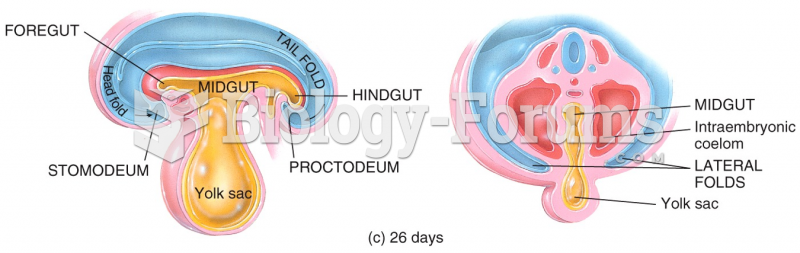 Embryonic Period
 A non-interest-bearing five-year note for $54600.00 issued May 1, 2015, is discounted April 1, ...