|
|
|

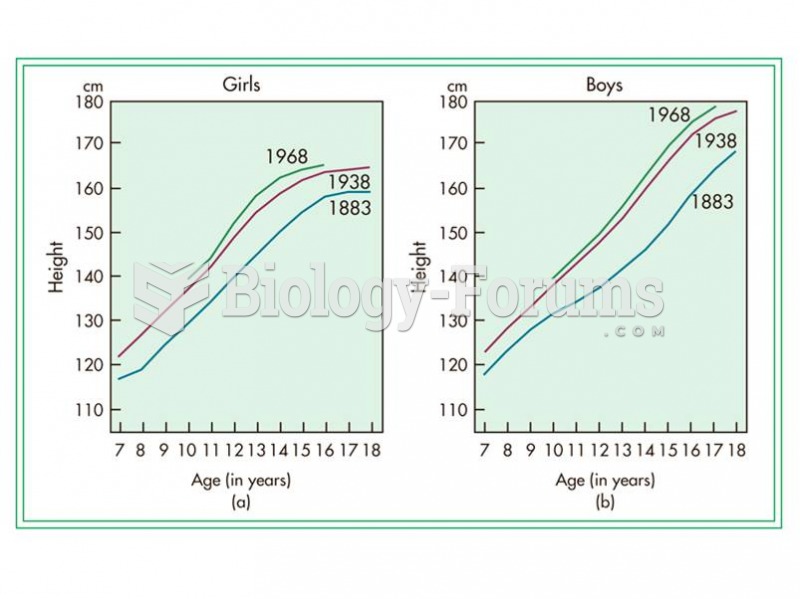 The secular trend in growth as measured in Swedish (a) girls and (b) boys between 1883 and 1968.
 The Ford logo on display at the 2009 New York International Auto Show.
 Preoperative photograph of a 43-year-old Caucasian male with necrotizing fasciitis on the day of ...
 The developing and emerging nations have high rates of population growth
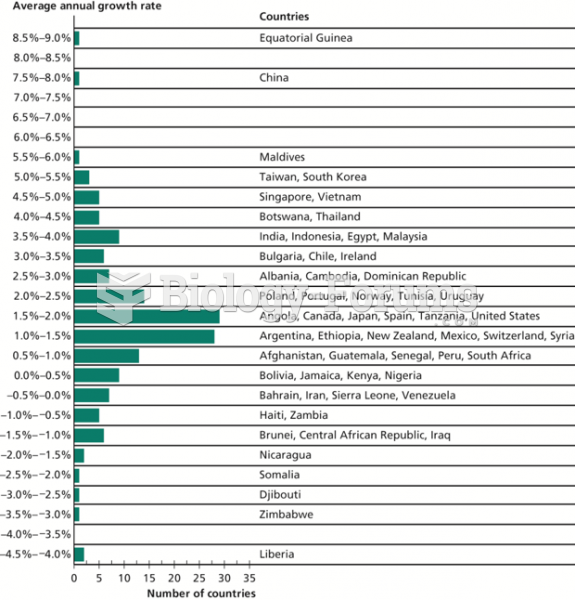 The Distribution of Growth Rates, 1975–2009
 Primary growth in a root