|
|
|

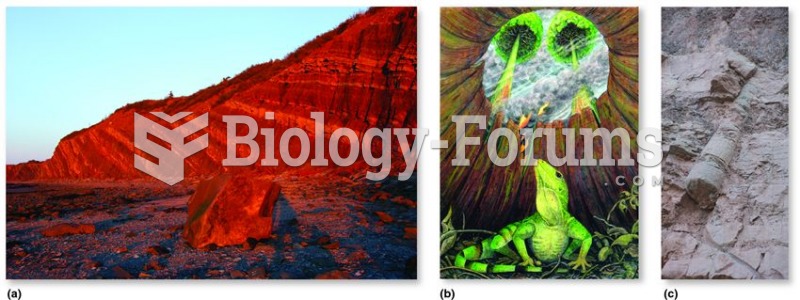 Fossil from the Carboniferous period
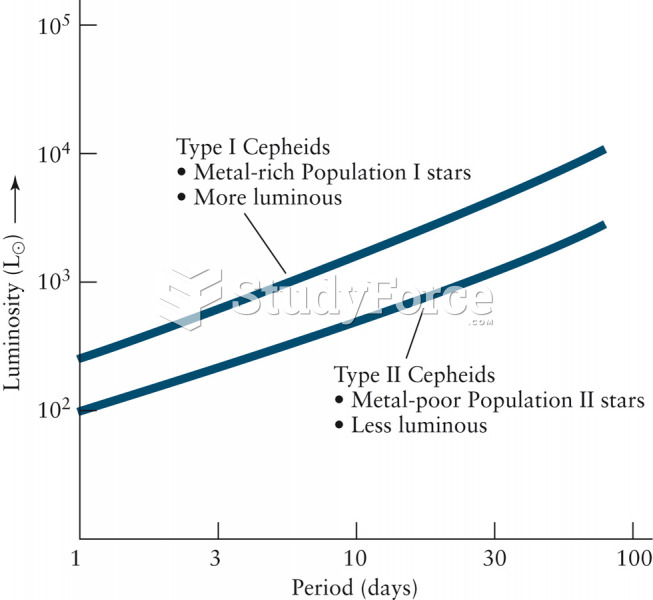 The Period-Luminosity Relation
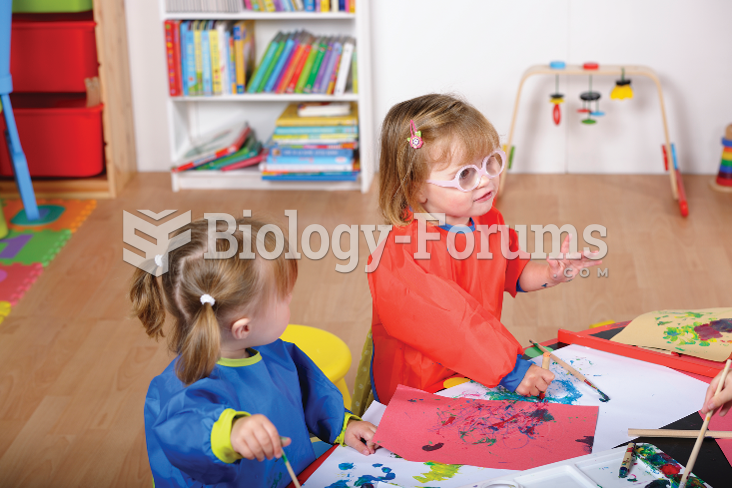 For the 2-year-old, encounters with peers provide valuable practice in communication and social ...
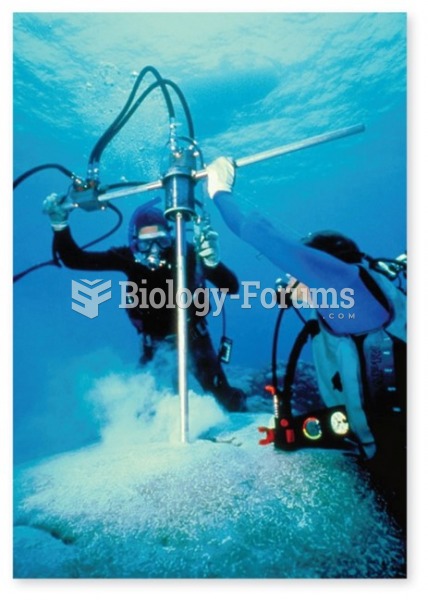 Coral growth rings as an indicator of environmental change
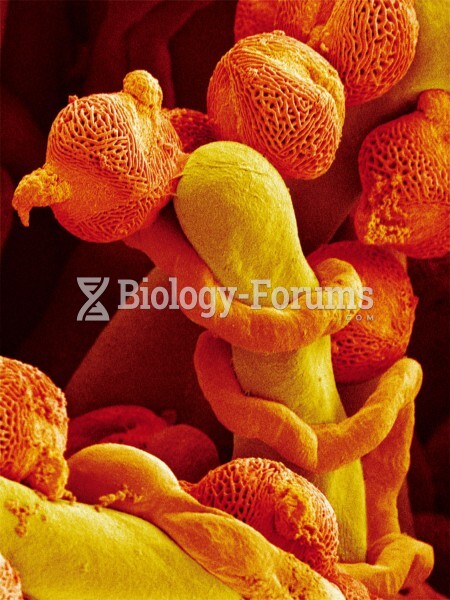 Pollen Tube Growth
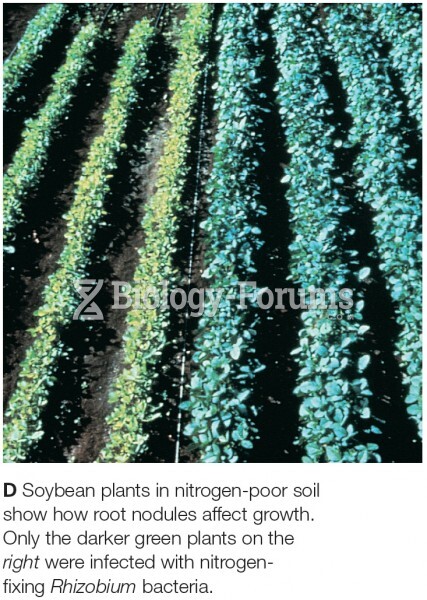 Soybean plants in nitrogen-poor soil show how root nodules affect growth. Only the darker green plan