This topic contains a solution. Click here to go to the answer
|
|
|

 Aquatic microclimates: aquatic environments generally show less temperature variation compared to te
 Older people who experienced stressful events in their younger years may show personal growth and ...
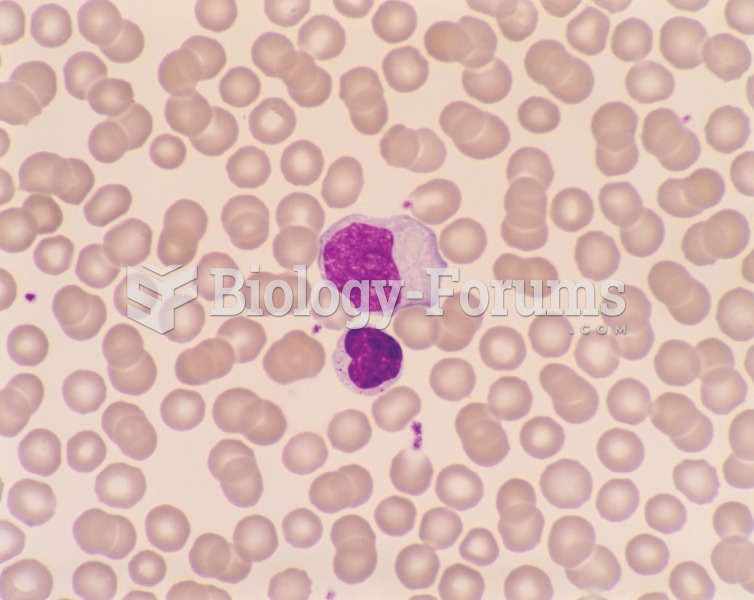 Two lymphocytes that are reactive in a 19-year-old college student with infectious mononucleosis. ...
 Embryonic Period
 Sam and Jen had a tax liability of 5,115 last year. They were entitled to tax credits of 112 ...
 Number line for rounding