This topic contains a solution. Click here to go to the answer
|
|
|

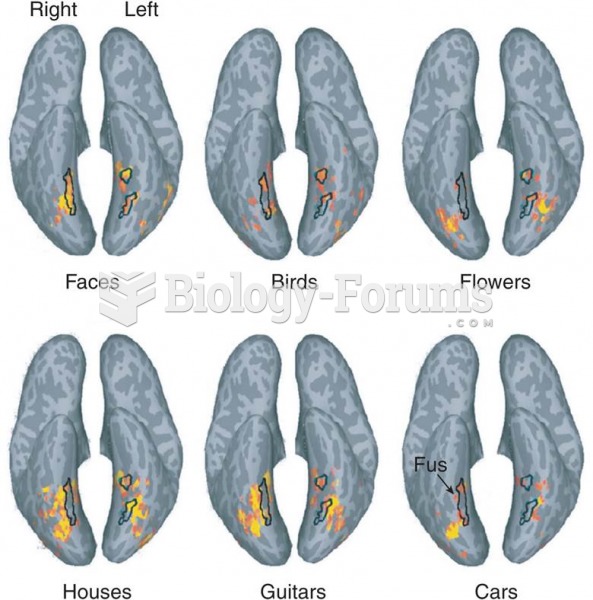 Responses to Categories of Visual Stimuli
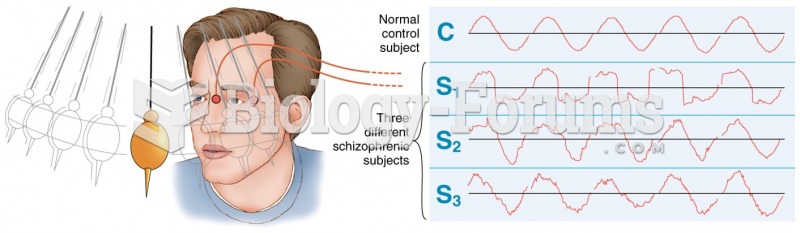 Visual tracking of a pendulum by a normal control subject (top) and three schizophrenics. (Adapted ...
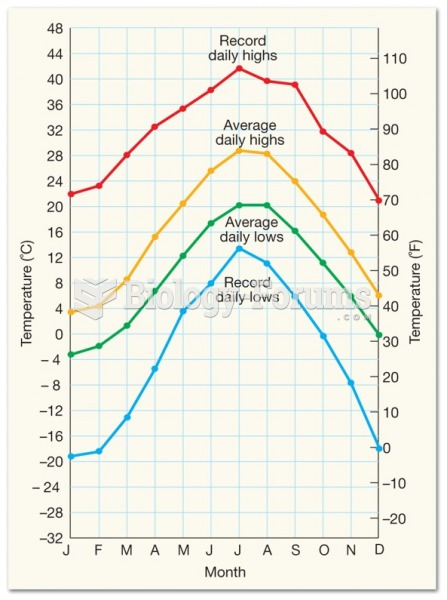 Atmospheric Hazards: Assault by the Elements
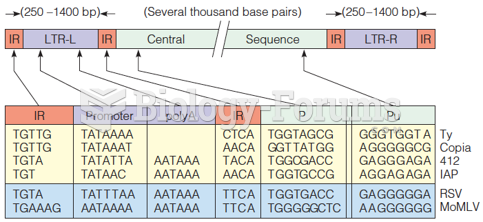 Common sequence features in integrated retroviruses and other eukaryotic transposable elements
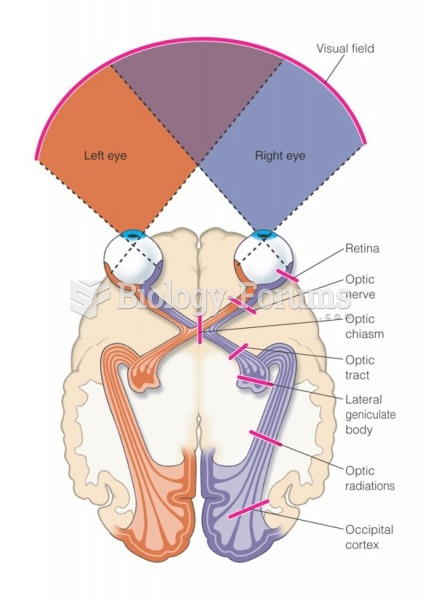 Normal visual pathways
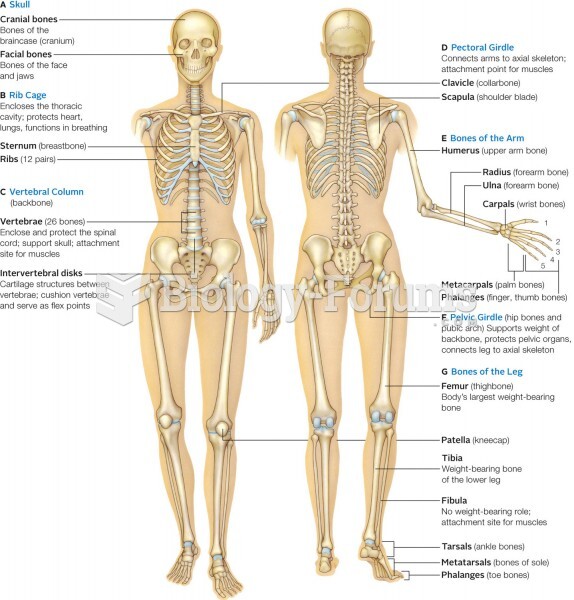 Major bone (tan) and cartilage (light blue) elements of the human skeleton. Inset shows regions of v