This topic contains a solution. Click here to go to the answer
|
|
|

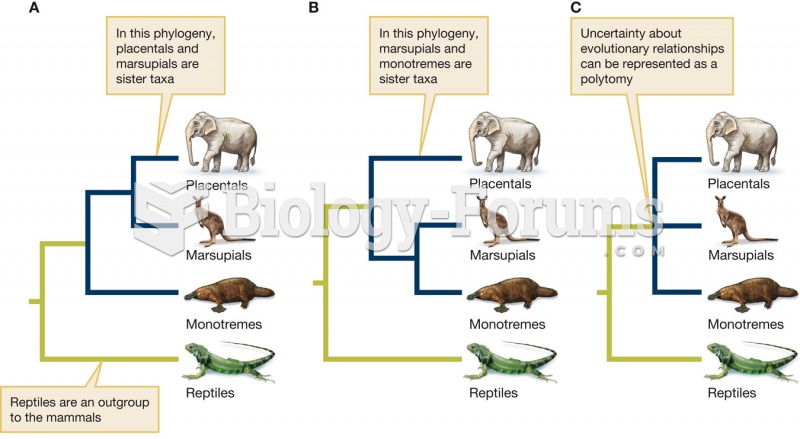 Polytomies represent uncertainty about phylogenetic relationships
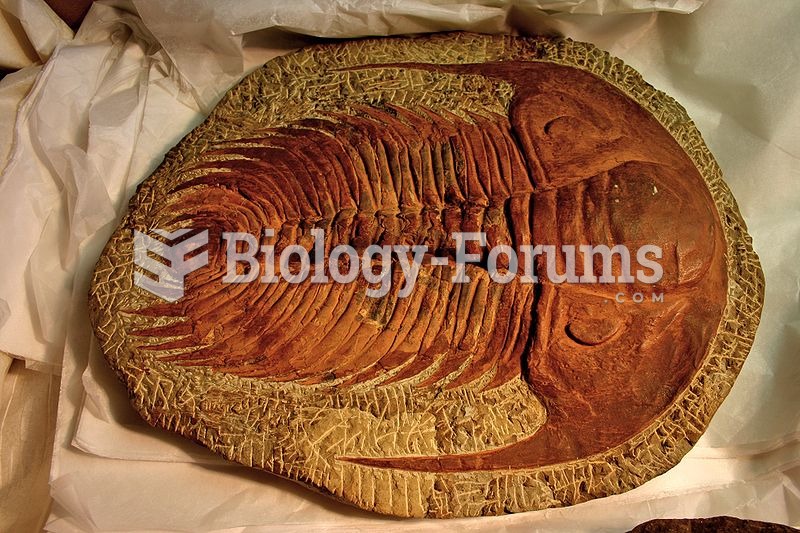 Redlichida, such as this Paradoxides, may represent the ancestral trilobites.
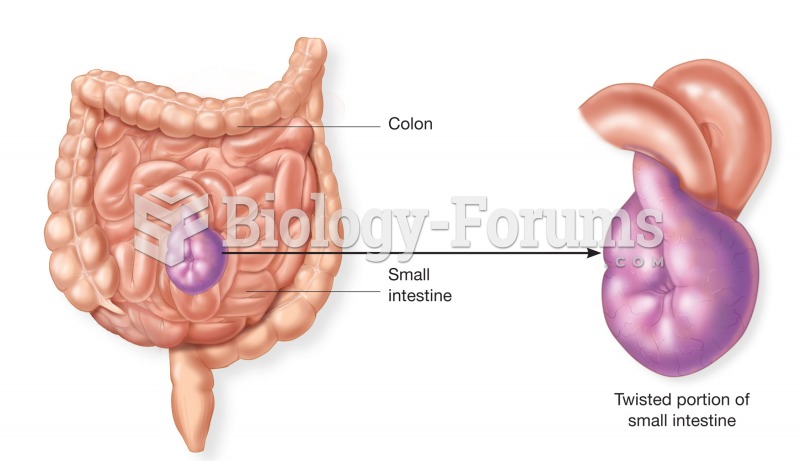 Volvulus. A length of small intestine has twisted around itself, cutting off blood circulation to th
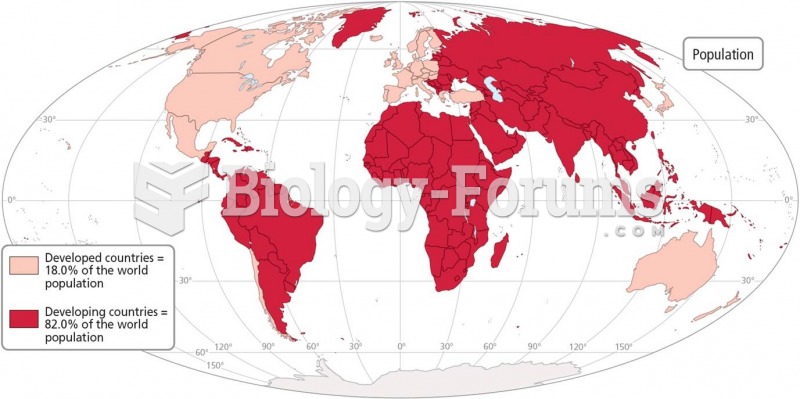 Worldwide Variations in Population and Income Levels Developed countries represent only 18% of the
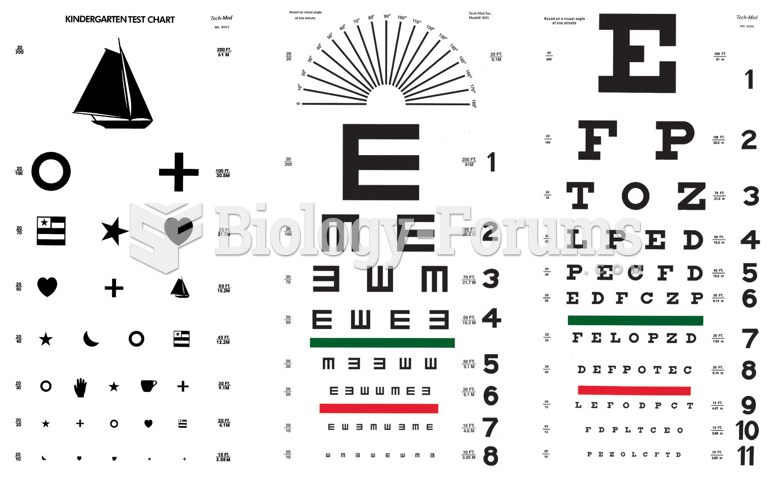 Different types of Snellen eye charts.
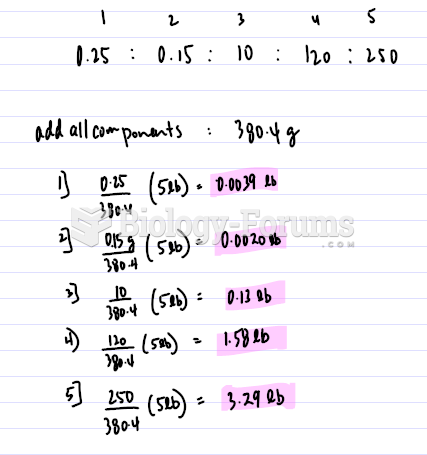 calculate the quantities required to make 5 lb of hydrophilic ointment: