This topic contains a solution. Click here to go to the answer
|
|
|

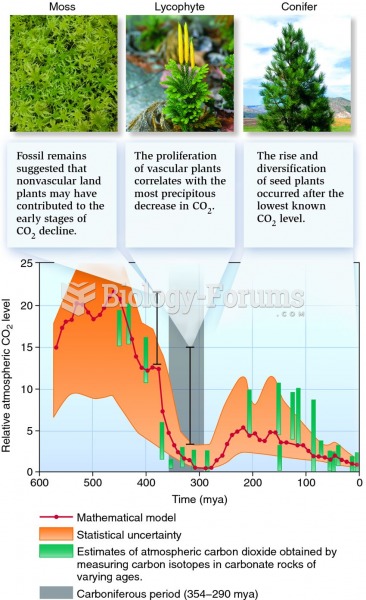 Changes in Earth's atmospheric carbon dioxide levels over geological time.
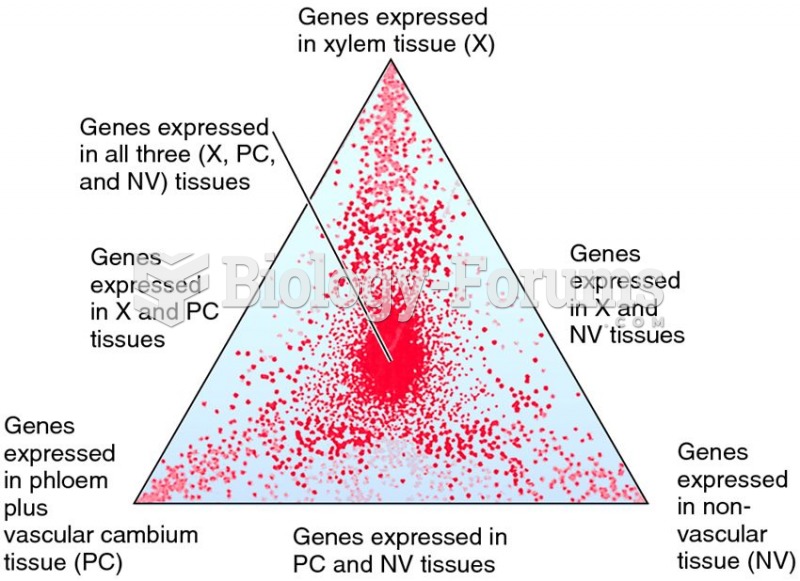 Triangle plot showing gene expression related to xylem, phloem, and nonvascular tissue in Arabidopsi
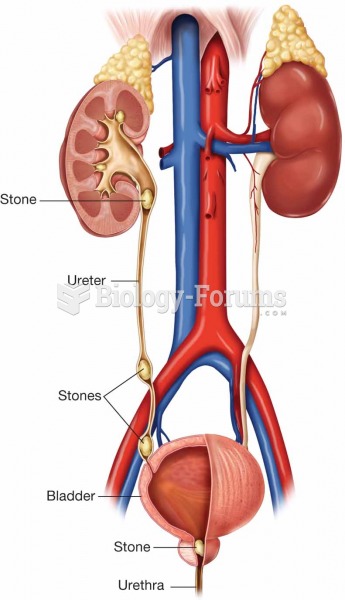 Renal calculi (stones) can form in several areas within the urinary tract. When they form in the kid
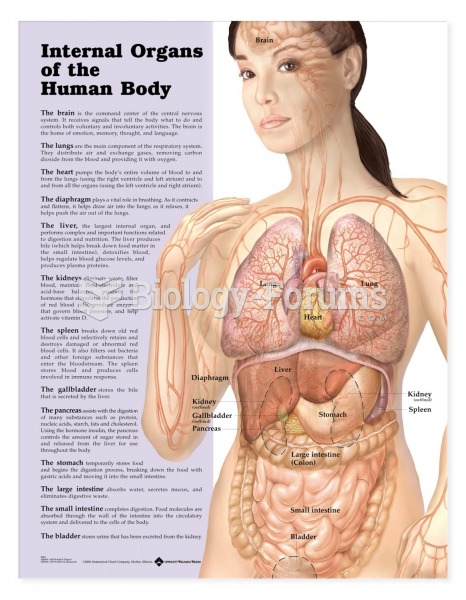 internal organs chart
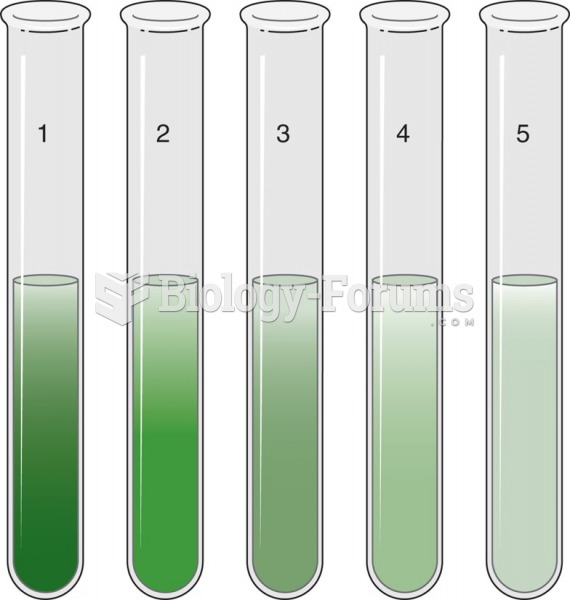 A 2-fold serial dilution showing the result of moving 0.2 ml of green food coloring successively ...