Which of the following statements about pie charts is false?
a. A pie chart is a graphical representation of a relative frequency distribution.
b. You can always determine frequencies for each category by looking at a pie chart.
c. The total percentage of all the slices of a pie chart is 100.
d. The area of a slice of a pie chart is the proportion of all the individuals that fall into that particular category.
Question 2
When dealing with the problem of non-constant variance, the reciprocal transformation means using _____.
a. 1/x as the independent variable instead of x
b. x2 as the independent variable instead of x
c. y2 as the dependent variable instead of y
d. 1/y as the dependent variable instead of y

 False killer whales
 All messages must be documented and placed in the patient's chart.
 Urine sediment chart.
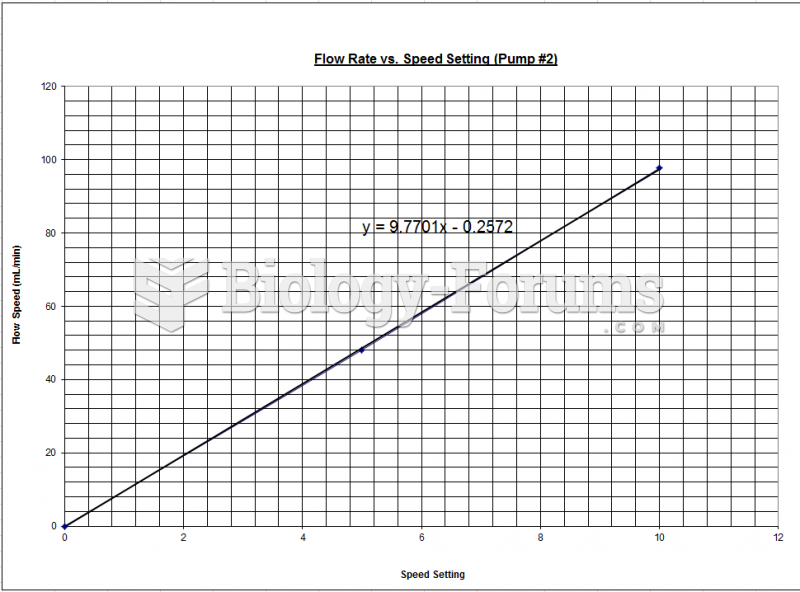 Fluidization - Chart Pump #2
 How to convert verbal statements into algebraic equations (Part 3)
 How to convert verbal statements into algebraic equations (Part 2)