|
|
|

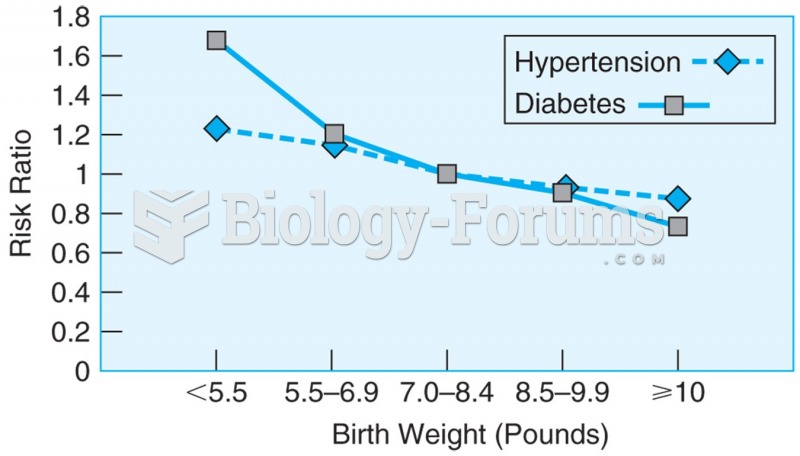 Data from more than 22,000 men over the age of 40, showing the relationship between birth weight and ...
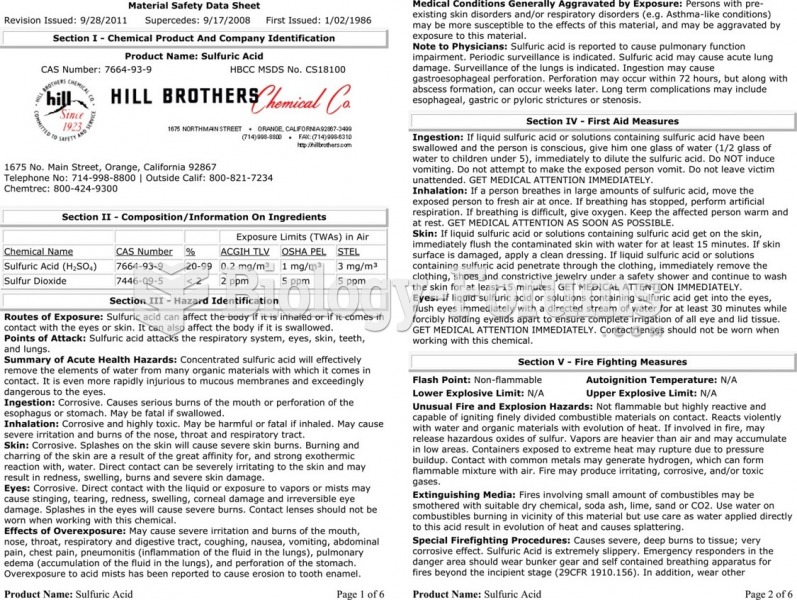 The material safety data sheet (MSDS) for sulfuric acid showing the detailed technical information ...
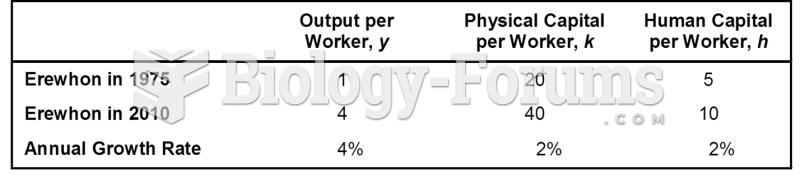 Data for Calculating Productivity Growth in Erewhon
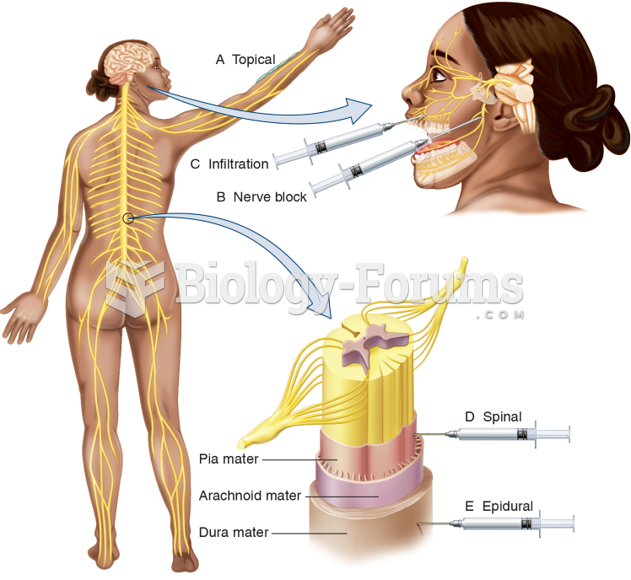 Techniques for Applying Local Anesthesia
 Solve the solution set of the following system using Graphical Method.
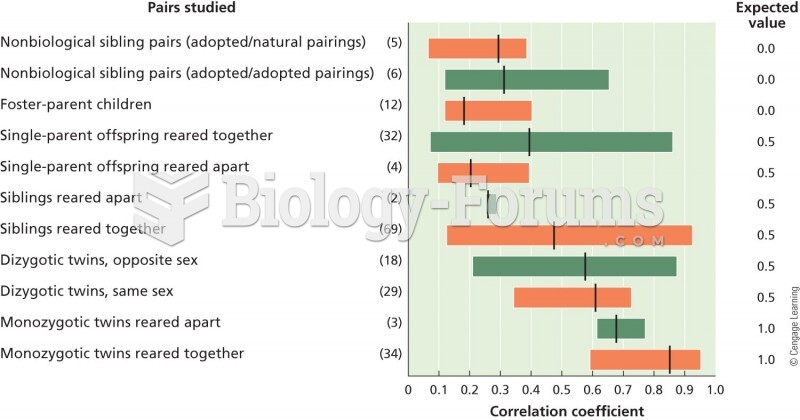 A graphical representation of correlations in IQ measurements in different sets of individuals. The