This topic contains a solution. Click here to go to the answer
|
|
|

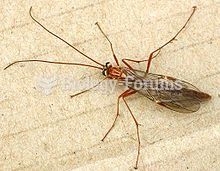 The term wasp is typically defined as any insect of the order Hymenoptera and suborder Apocrita that
 Young children typically are boundlessly curious about the world around them.
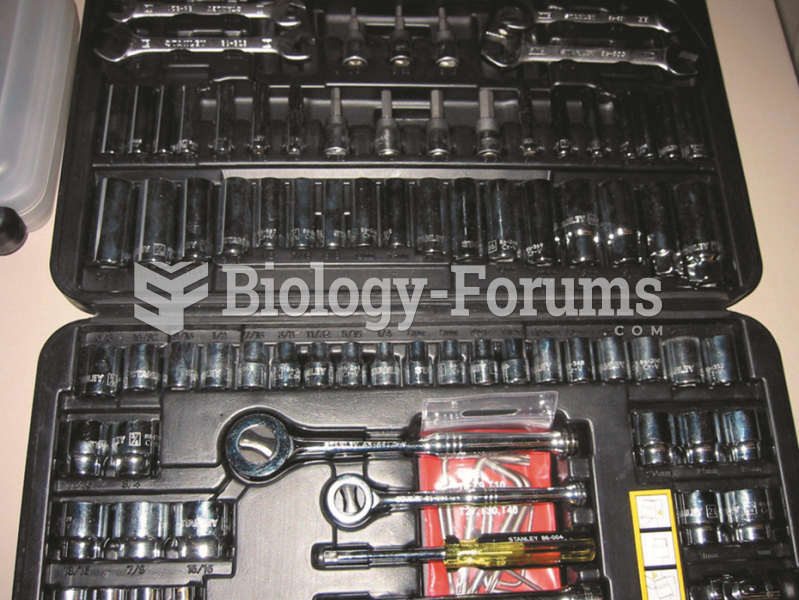 A typical beginning technician tool set that includes the basic tools to get started.
 An exhaust manifold spreader tool is a tool that is absolutely necessary to use when reinstalling ...
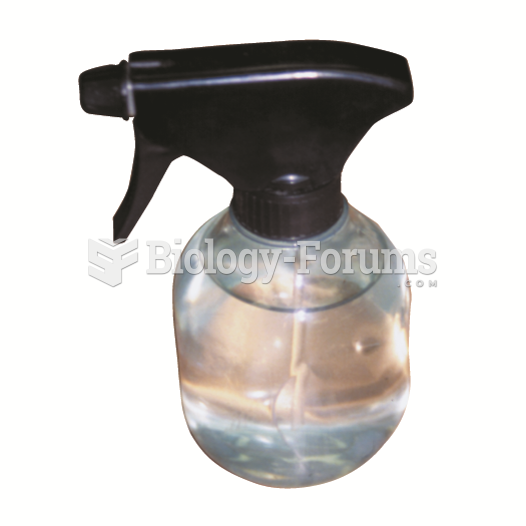 A water spray bottle is an excellent diagnostic tool to help find an intermittent engine misfire ...
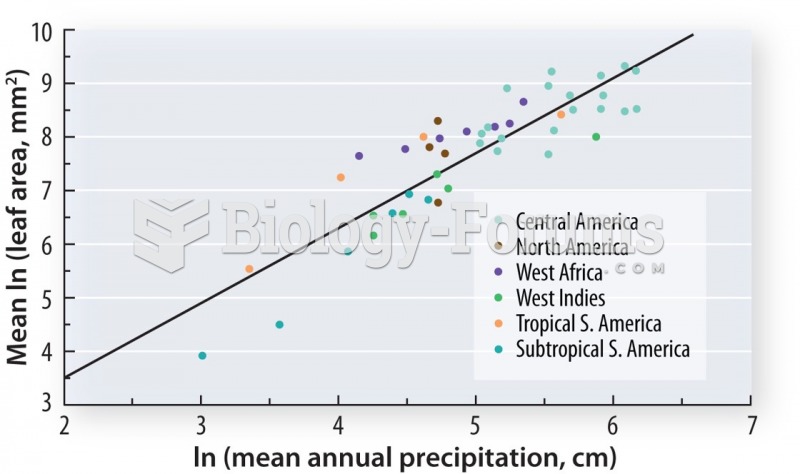 Fossils as indicators of climate