The most common graphical presentation of quantitative data is a
a. histogram.
b. bar chart.
c. stem and leaf display.
d. pie chart.
Question 2
All of the following are true about qualitative forecasting methods except
a. They generally involve the use of expert judgment to develop forecasts.
b. They assume the pattern of the past will continue into the future.
c. They are appropriate when past data on the variable being forecast are not applicable.
d. They are appropriate when past data on the variable being forecast are not available.

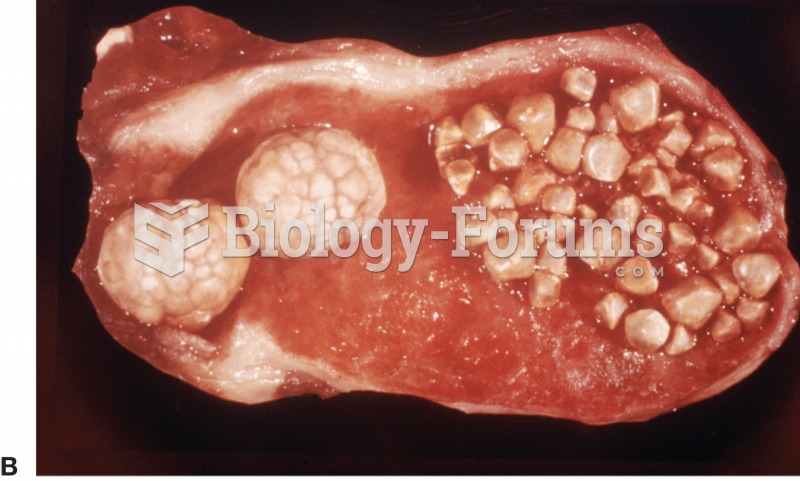 (A) Common sites for cholelithiasis; (B) a gallbladder specimen with multiple gallstones.
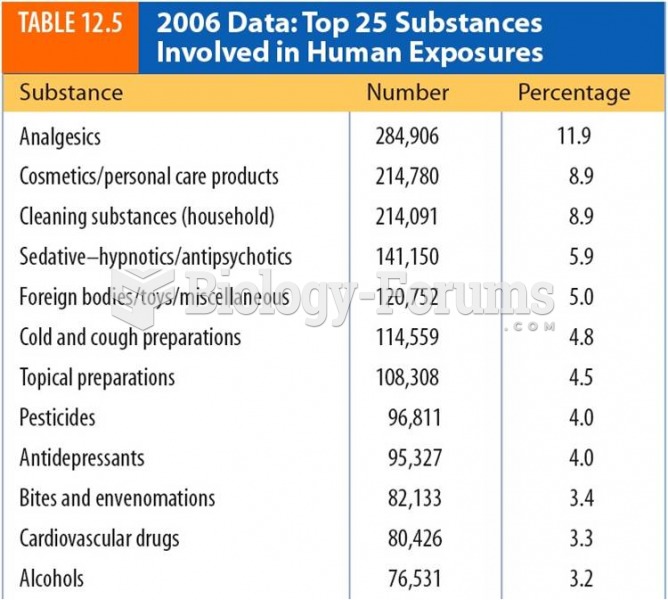 2006 Data:Top 25 Substances Involved in Human Exposures
 Common phlebotomy issues.
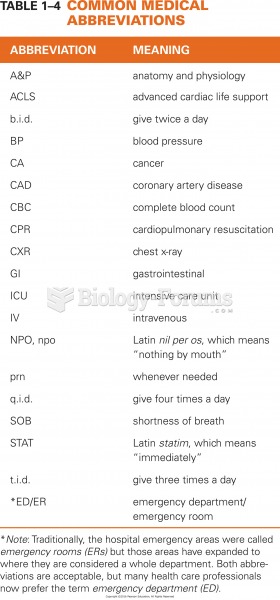 Common Medical Abbreviations
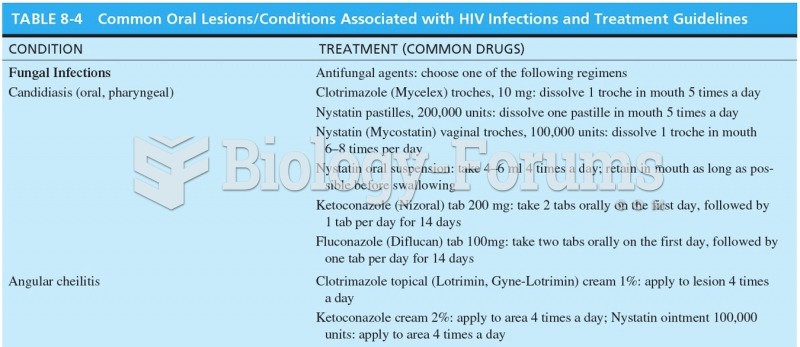 Common Oral Lesions/Conditions Associated with HIV Infections and Treatment Guidelines
 Gamete genotype frequencies calculated from genetic linkage data