|
|
|

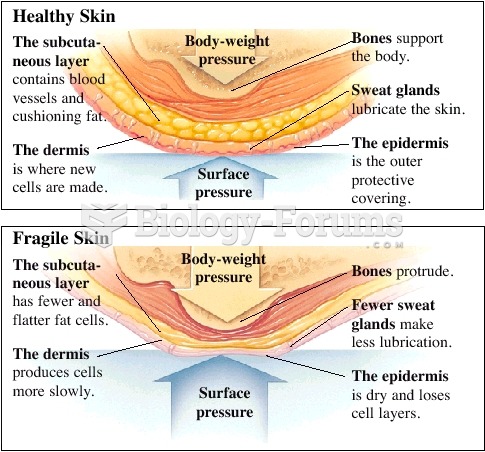 human skin and pressure points
 A sidewheeler on the Mississippi. In 1856 Samuel Clemens became an apprentice to a steamboat pilot a
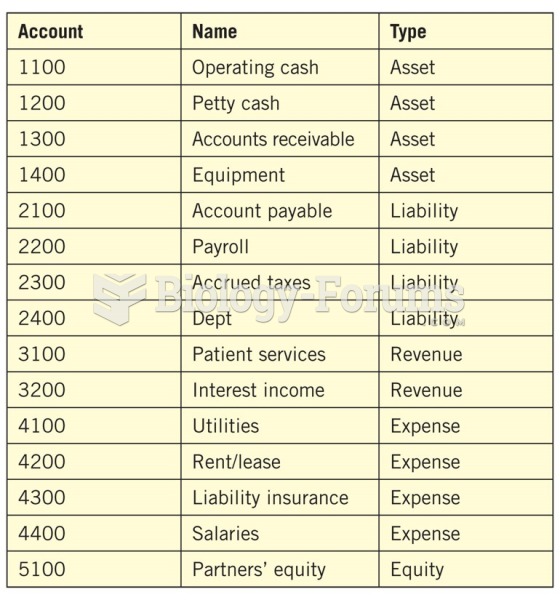 Example of a chart of accounts.
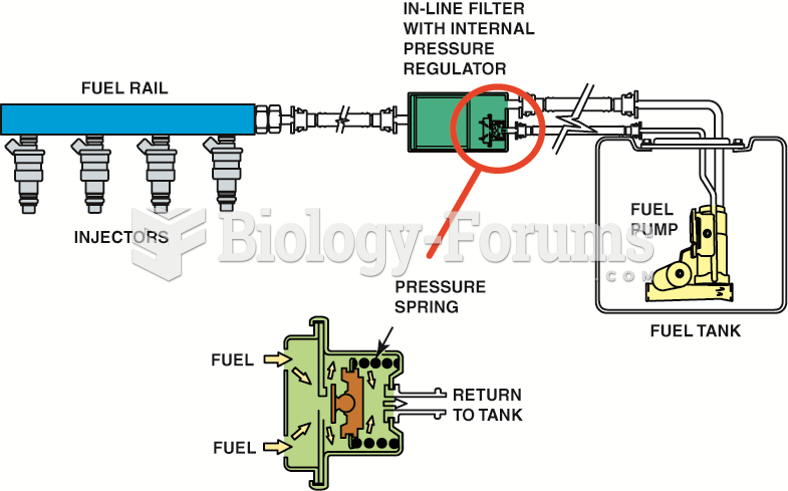 A mechanical returnless fuel system. The bypass regulator in the fuel tank controls fuel line ...
 People who share genes will often have similar body weights
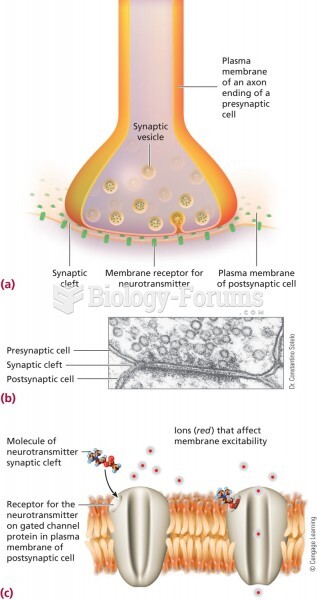 The synapse and synaptic transmission. (a) A thin cleft, called the synapse, separates one cell from