This topic contains a solution. Click here to go to the answer
|
|
|

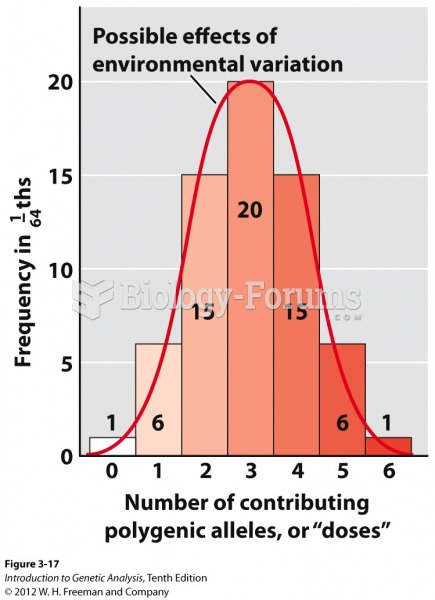 Histogram of polygenes from a trihybrid self
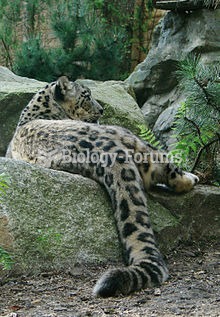 Snow leopard at zoo d'Amneville, France, showing the thickly furred tail
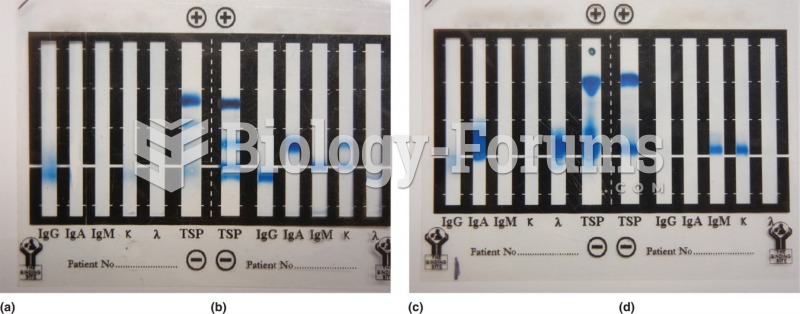 Immunofixation electrophoresis. (a) IgG kappa myeloma, (b) Controls showing total serum protein ...
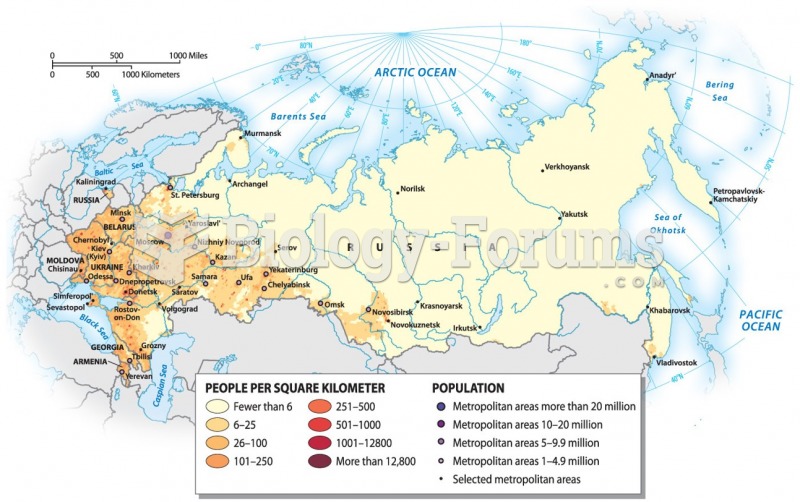 Population Distribution
 The Distribution of Water on Earth
 Discrete random variables- Probability Distribution Function