This topic contains a solution. Click here to go to the answer
|
|
|

 This jumping spider's main ocelli (center pair) are very acute.
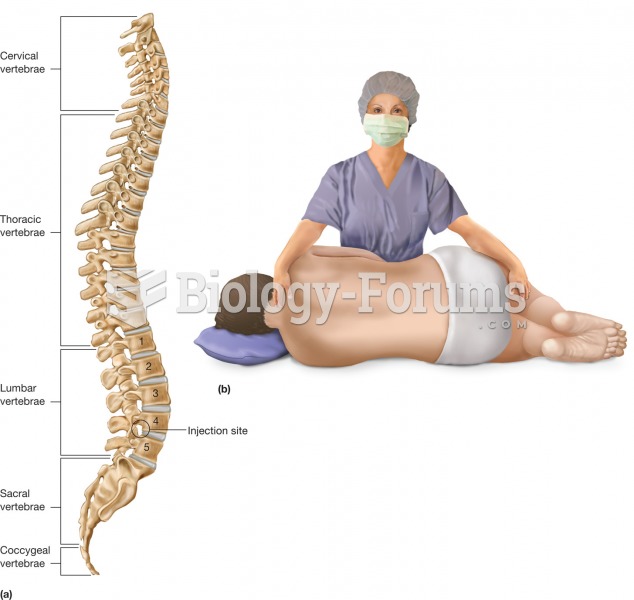 Lumbar puncture. Abbreviated LP, the lumbar puncture is a common procedure that withdraws cerebrospi
 Anatomy diagram
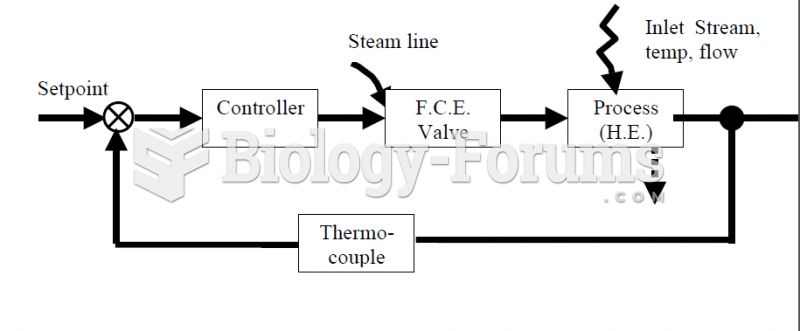 Heat Exchanger Block Diagram Feedback Control System
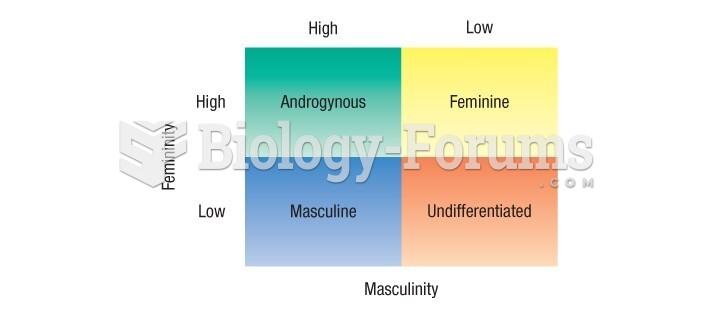 Diagram illustrates how the dimensions of masculinity and femininity
 The consequences of base-pair substitutions