This topic contains a solution. Click here to go to the answer
|
|
|

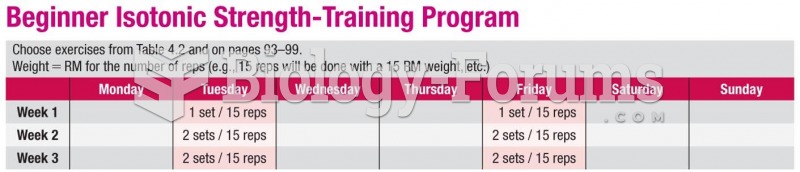 Sample Exercise Prescription for Weight Training: Beginner
 Monitoring and Following Up on Laboratory Test Results
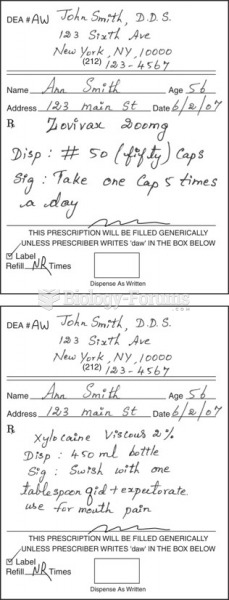 Sample prescriptions of drugs for oral herpes infection.
 Clear the inguinal catchment area. Face the side of the table at recipient’s waist. Place your ...
 The decay rate of a radioactive sample decreases from 175 kBq to 12.4 kBq in 18.3 s. What is ...
 Wood coffee table