This topic contains a solution. Click here to go to the answer
|
|
|

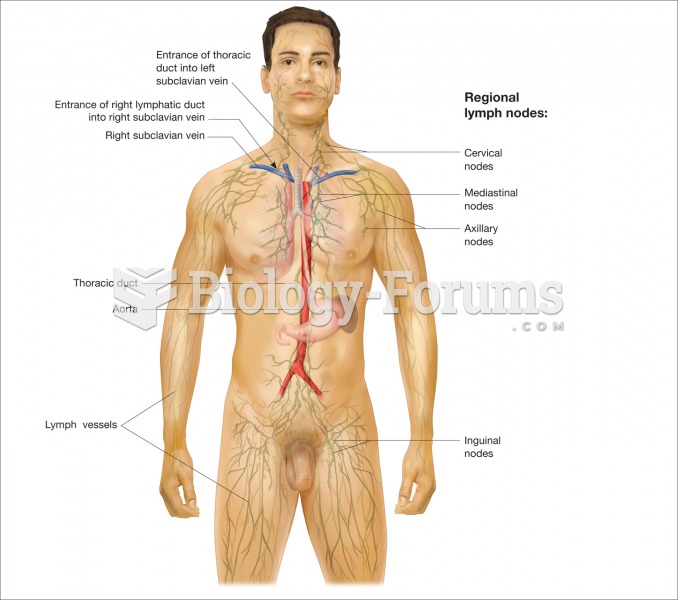 Location of lymph vessels, lymphatic ducts, and areas of lymph node concentrations.
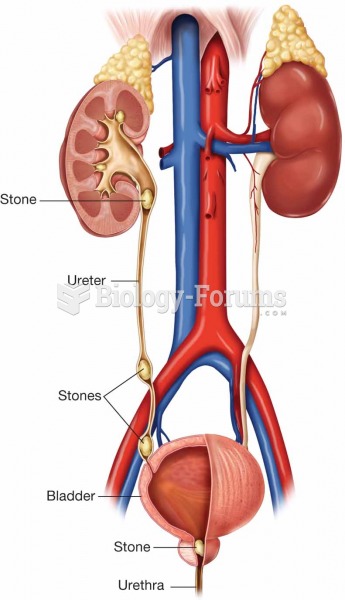 Renal calculi (stones) can form in several areas within the urinary tract. When they form in the kid
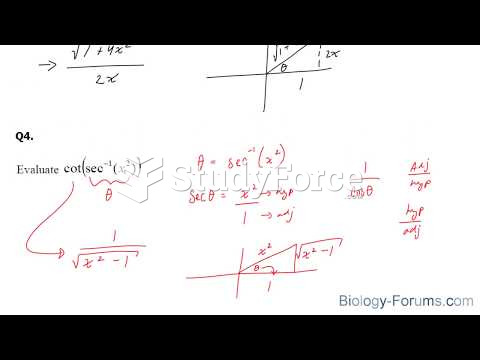 How to evaluate trigonometric functions when theta is an inverse trigonometric function
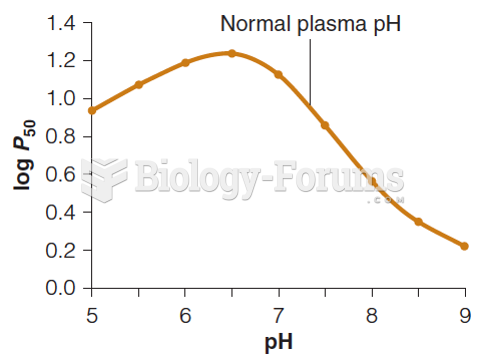 Oxygen affinity of hemoglobin as a function of pH
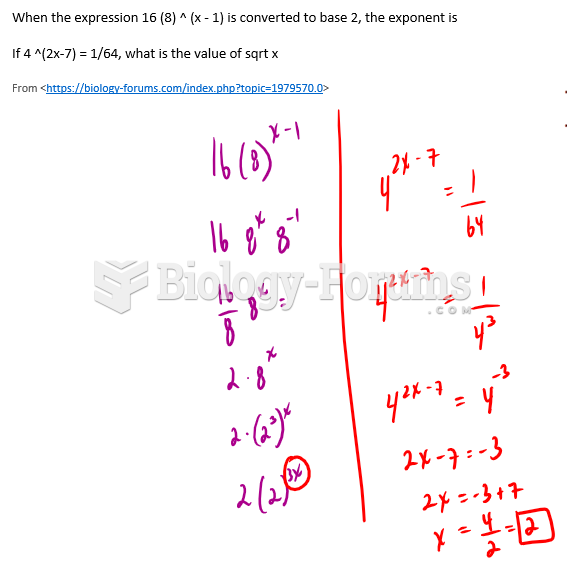 Find the value exponential and log function
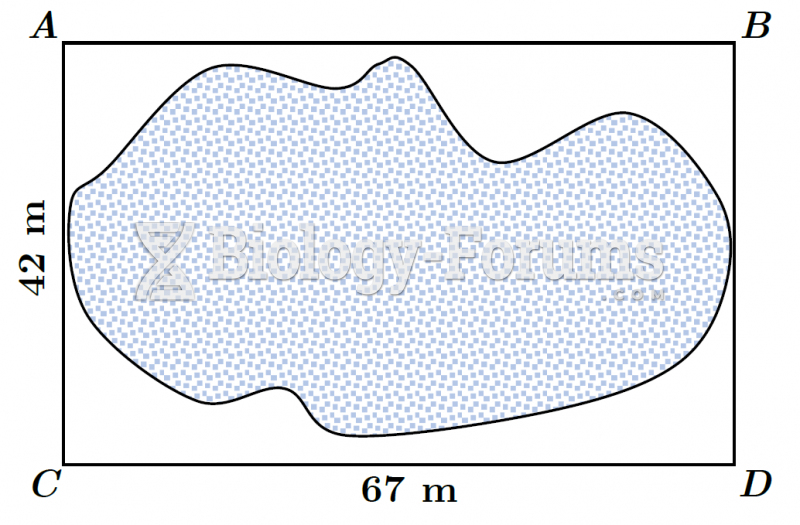 Plot of Land (Modified Offset Method) - Boxed