This topic contains a solution. Click here to go to the answer
|
|
|

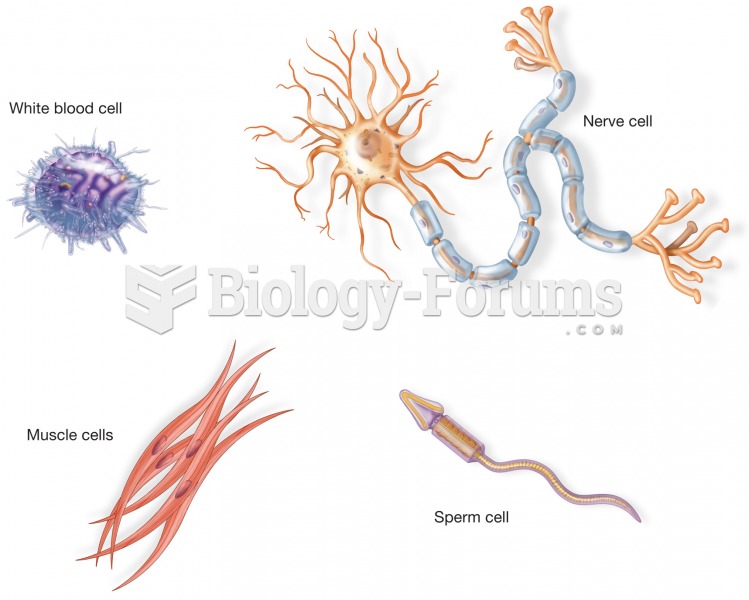 Examples of four different types of cells from the body. Although each cell has a cell membrane, nuc
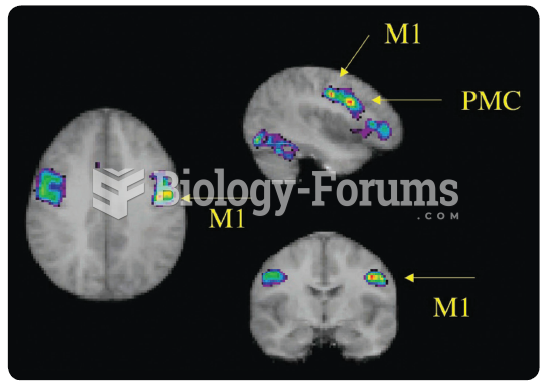 Horizontal, sagittal, and coronal functional MRIs show areas of increased activity in the primary ...
 How to find the domain of a function (Part 2)
 How B Vitamins Function as Coenzymes (c)
 Testing motor function of cranial nerve VII - Smile
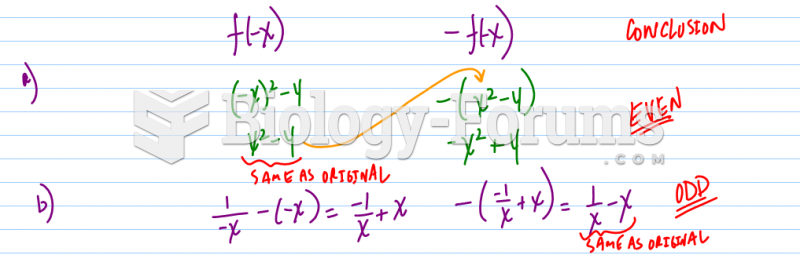 Function, even or odd, solution