This topic contains a solution. Click here to go to the answer
|
|
|

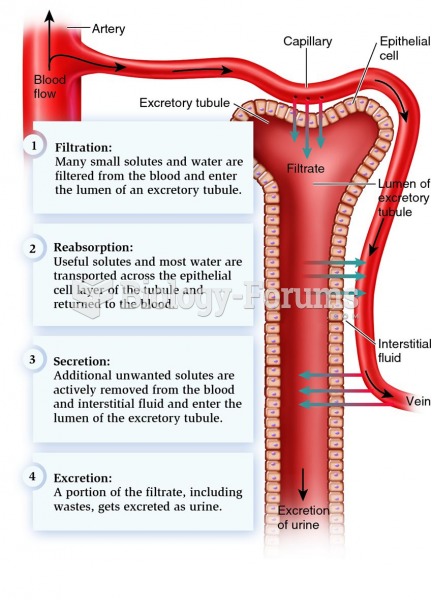 Basic features of the function of many excretory systems.
 The Reticular Activating System and Related Regions in the Brain Are Important Areas of Focus for D
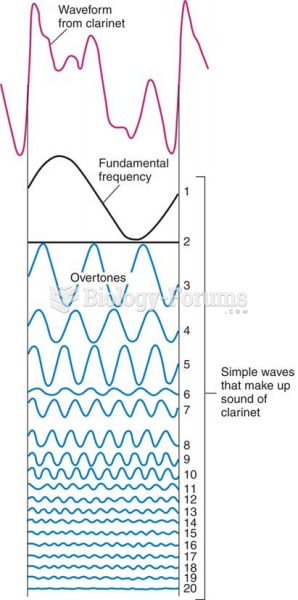 Sound Waves from Clarinet
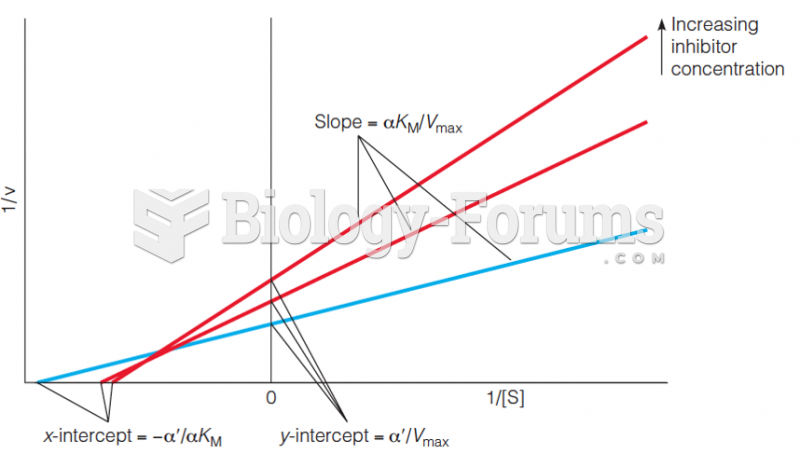 Lineweaver–Burk plot for mixed inhibition kinetics
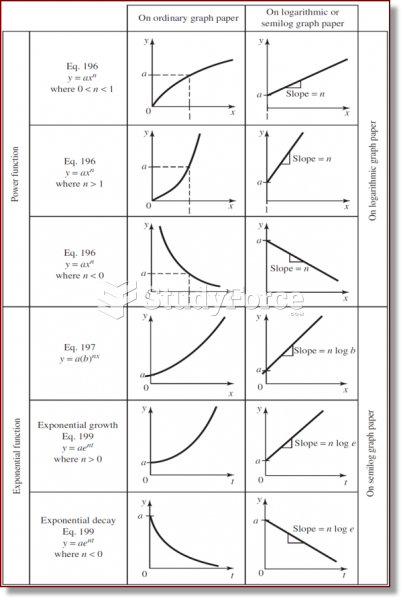 Exponential Function vs. Power Function
 Sustainable Food Systems Are Environmentally Friendly, Economically Sound, and Socially Equitable