This topic contains a solution. Click here to go to the answer
|
|
|

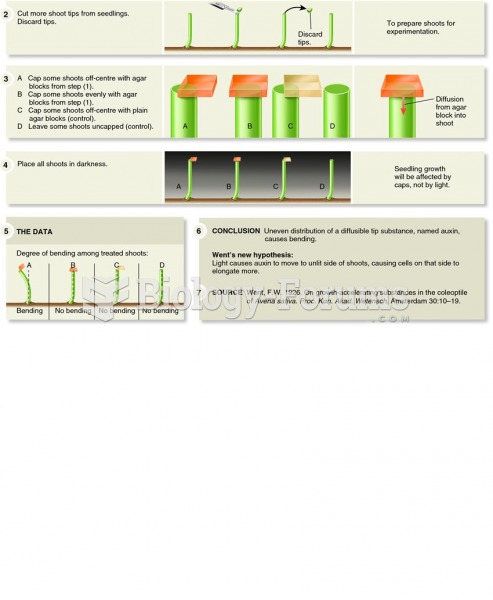 Went and Briggs demonstrated the relationship between light perception and auxin function.
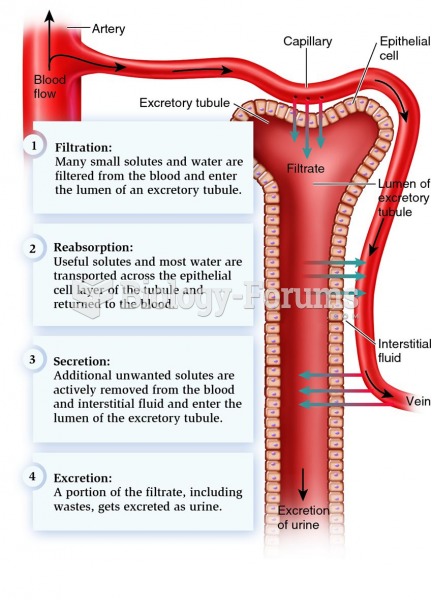 Basic features of the function of many excretory systems.
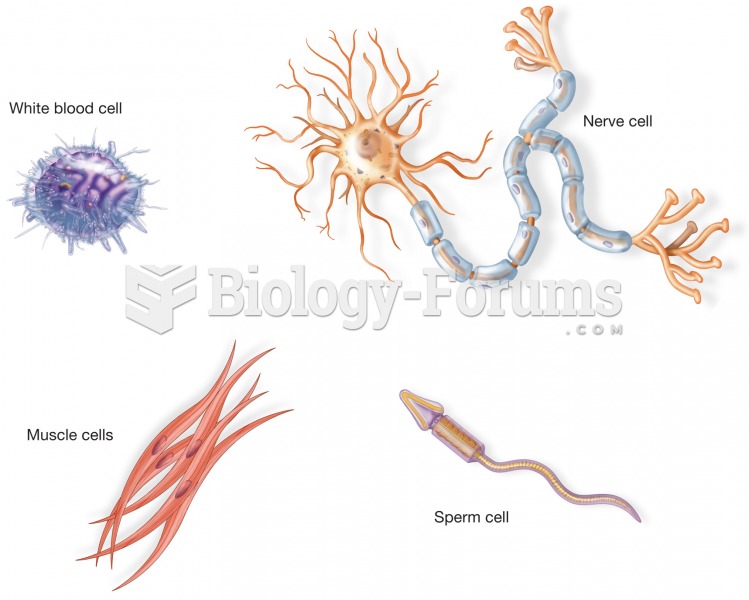 Examples of four different types of cells from the body. Although each cell has a cell membrane, nuc
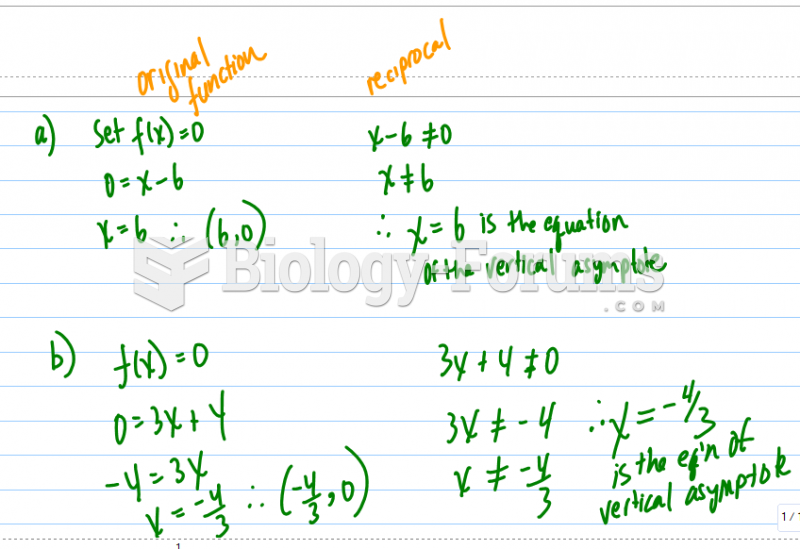 Asymptote of Reciprocal Function
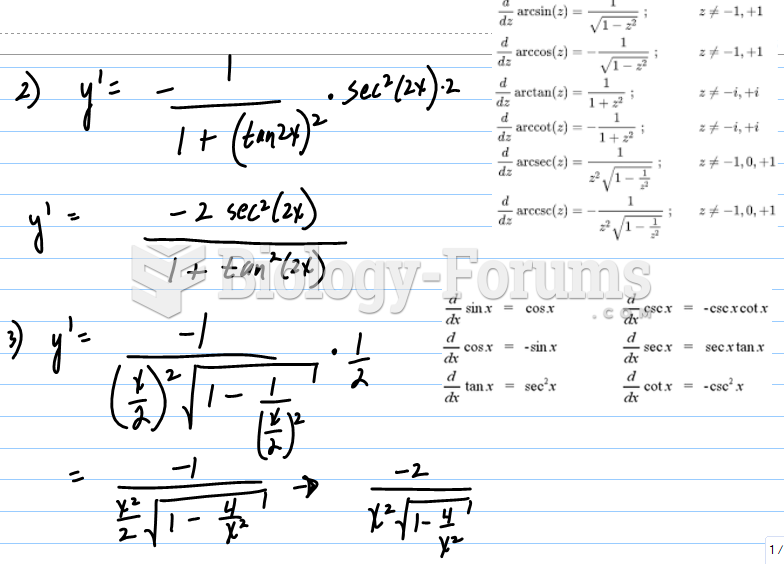 Differentiation of Inverse Trigonometric Function
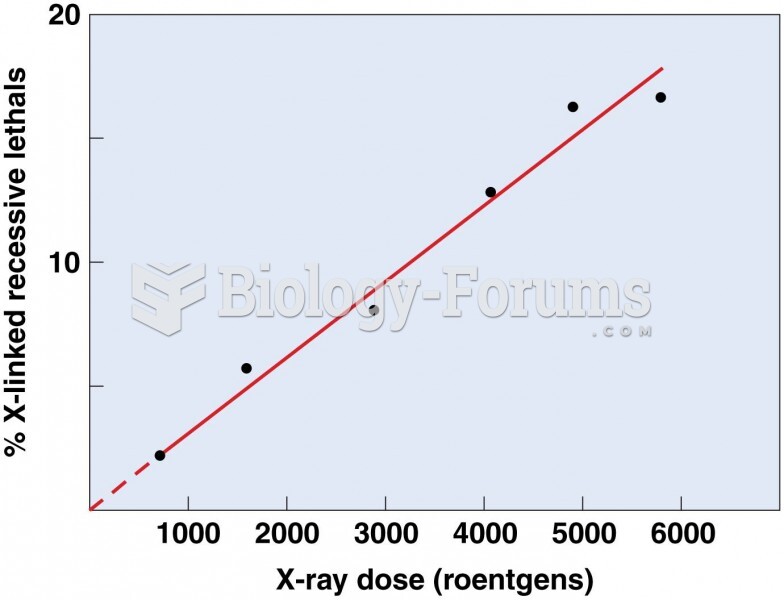 Plot of the percentage of X-linked recessive mutations