|
|
|

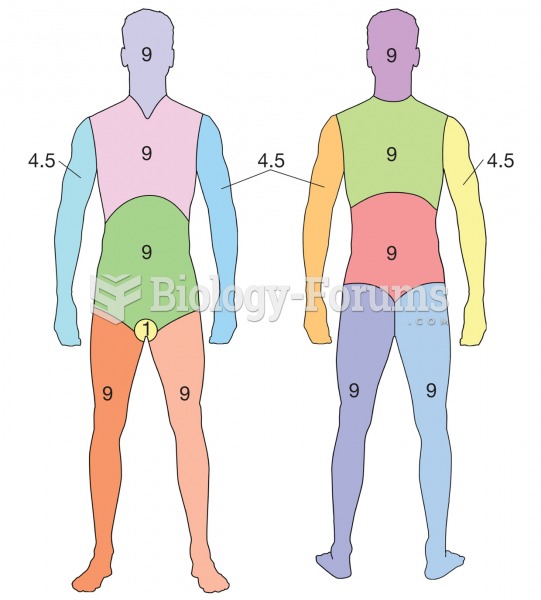 Rule of Nines. A method for determining percentage of body burned. Each different colored section re
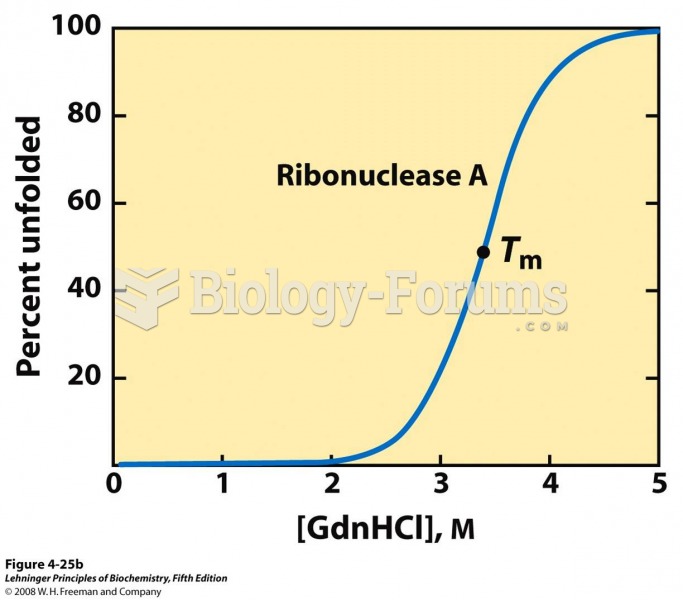 Results are shown for proteins denatured by two different environmental changes
 The overlapping relationship among research, evidence-based practice
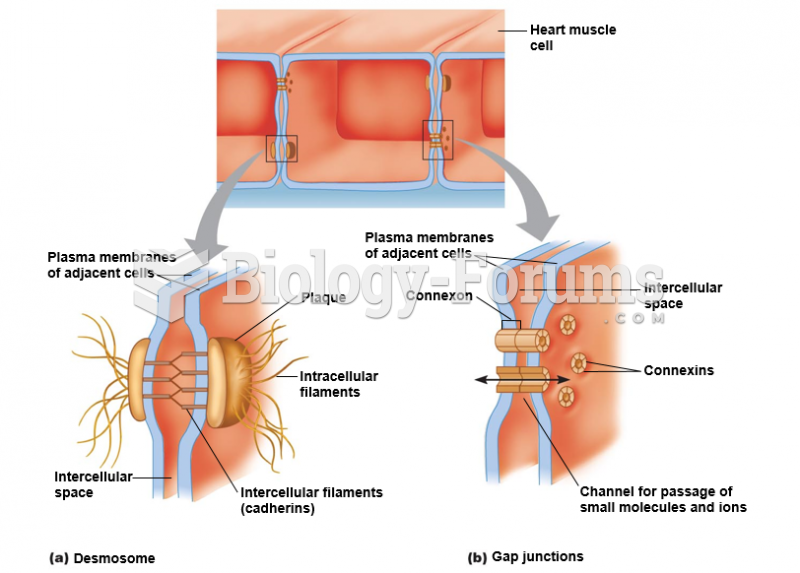 Desmosomes and gap junctions, as shown in heart muscle.
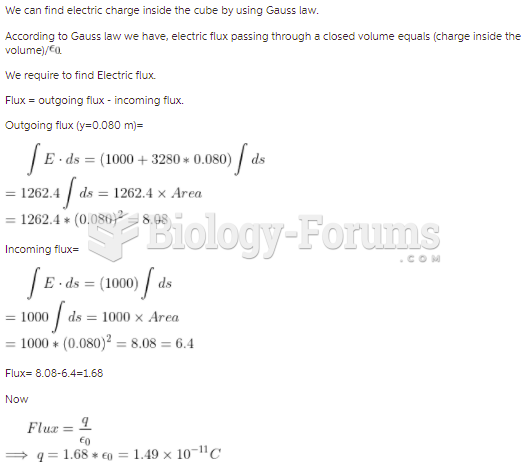 The cube of insulating material shown in the figure has one corner at the origin. Each side of ...
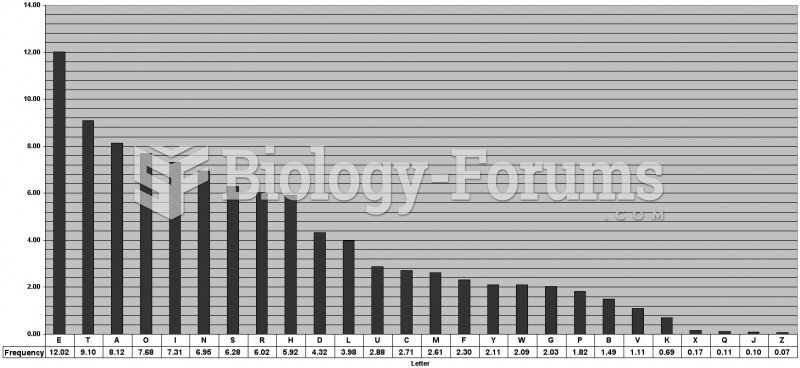 Letter Frequency Table