This topic contains a solution. Click here to go to the answer
|
|
|

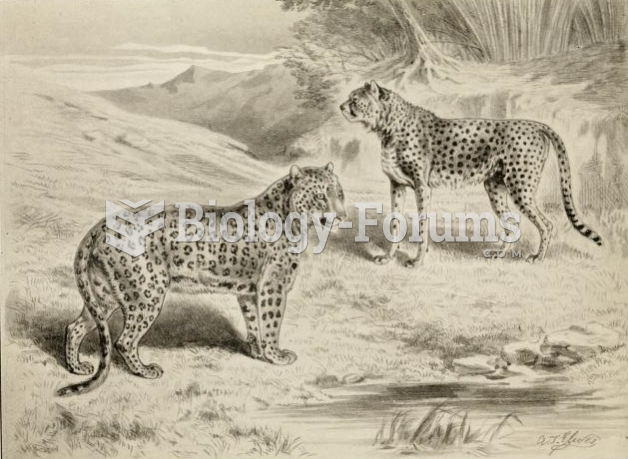 Comparative illustration of a leopard (left) and cheetah (right)
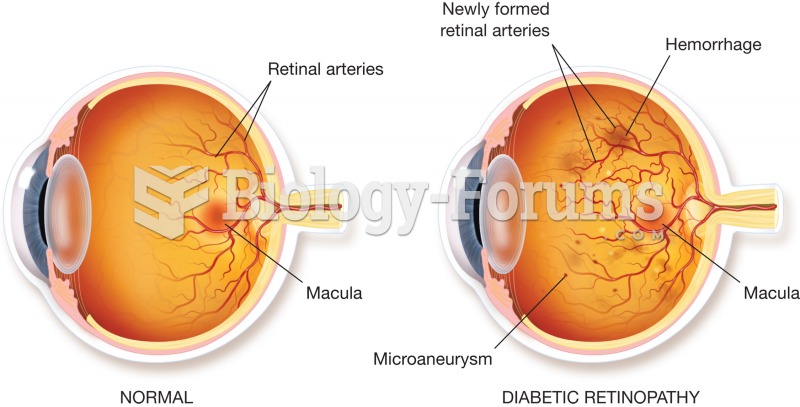 Retinopathy. Illustration of a normal retina (left) and a diseased retina (right). The diseased reti
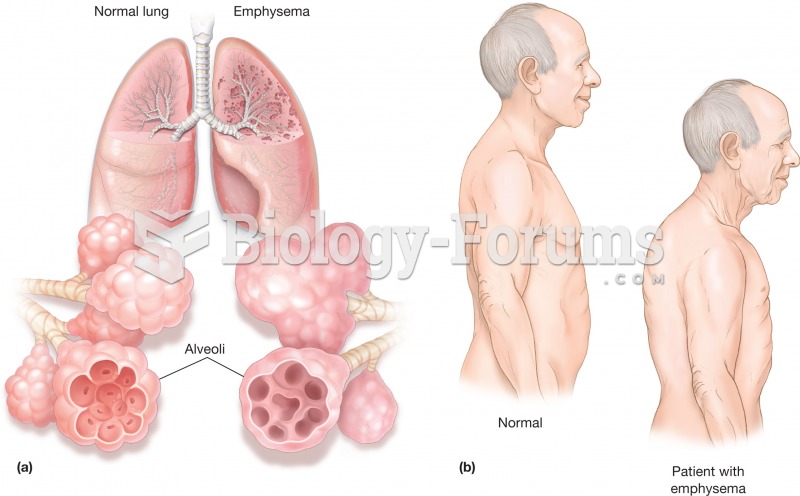 Emphysema. (a) Illustration comparing normal lungs and emphysemic lungs. The inserts illustrate how
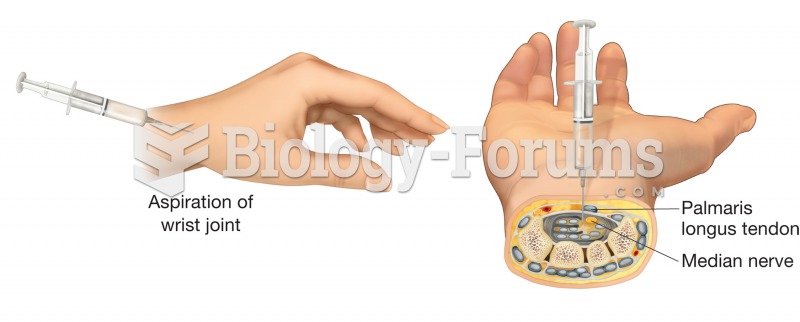 Arthrocentesis. The aspiration of fluid is a common treatment for joint injuries resulting in inflam
 Find the derivative using the product rule
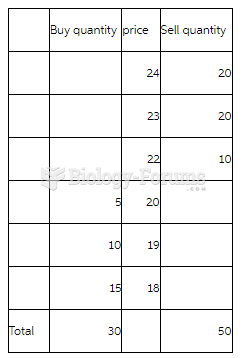 Markets and Institutions Market Story Problem