This topic contains a solution. Click here to go to the answer
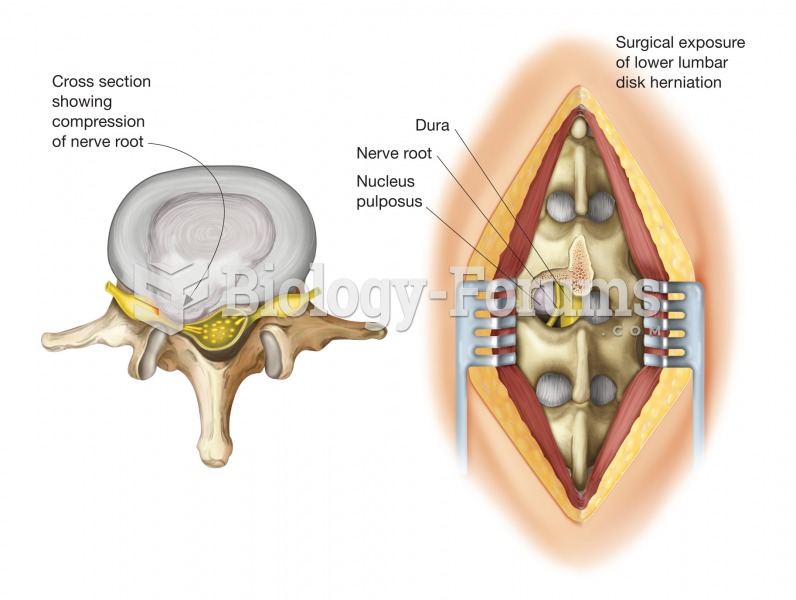
Author Question: The illustration of the market share for the top brand in a product category for the previous twelve ... (Read 30 times)

burton19126

  • Hero Member
  • *****
  • Posts: 532
The illustration of the market share for the top brand in a product category for the previous twelve quarters could best be accomplished by use of a:
 a. divided-bar chart.
  b. stacked-line chart.
  c. two-scale vertical bar chart.
  d. pie chart.
  e. line chart.

Question 2

Trends can be displayed best by using a:
 a. pie chart.
  b. line chart.
  c. pictograph.
  d. bar chart.
  e. histogram.


Related Topics

Need homework help now?

Ask unlimited questions for free

Ask a Question
Marked as best answer by a Subject Expert

chjcharjto14

  • Sr. Member
  • ****
  • Posts: 342
Answer to Question 1

E

Answer to Question 2

B


burton19126

  • Member
  • Posts: 532
Reply 2 on: Jun 29, 2018
Excellent


at

  • Member
  • Posts: 359
Reply 3 on: Yesterday
Wow, this really help


Did you know?

The calories found in one piece of cherry cheesecake could light a 60-watt light bulb for 1.5 hours.

Did you know?

Approximately 500,000 babies are born each year in the United States to teenage mothers.

Did you know?

Carbamazepine can interfere with the results of home pregnancy tests. If you are taking carbamazepine, do not try to test for pregnancy at home.

Did you know?

Acute bronchitis is an inflammation of the breathing tubes (bronchi), which causes increased mucus production and other changes. It is usually caused by bacteria or viruses, can be serious in people who have pulmonary or cardiac diseases, and can lead to pneumonia.

Did you know?

The shortest mature adult human of whom there is independent evidence was Gul Mohammed in India. In 1990, he was measured in New Delhi and stood 22.5 inches tall.

For a complete list of videos, visit our video library