This topic contains a solution. Click here to go to the answer
|
|
|

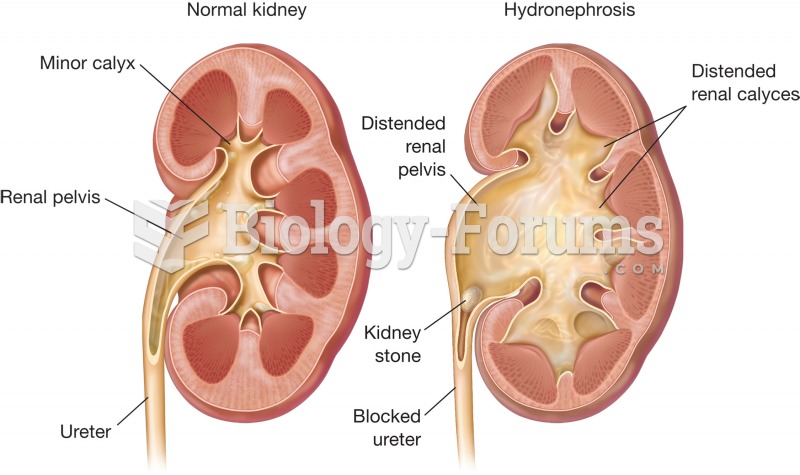 Hydronephrosis. Normal kidney (left) and kidney with hydronephrosis (right) are compared. Note the d
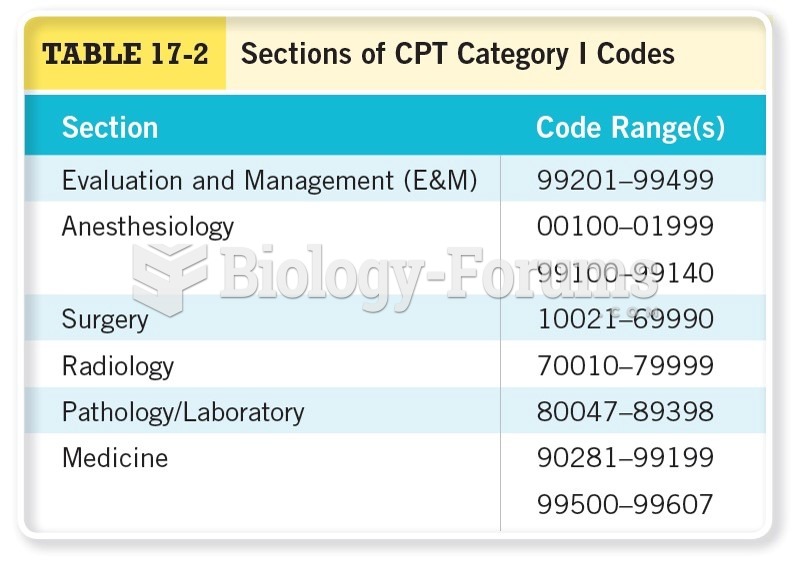 Sections of CPT Category I Codes
 Share of Human Capital in Wages in Developing Countries
 Importance of Considering Gestalt Principles in Product Design (2 of 2)
 Use the product rule to find derivative
 Schematic illustration of the morphologic changes in cell injury culminating in A necrosis or B apop