This topic contains a solution. Click here to go to the answer
|
|
|

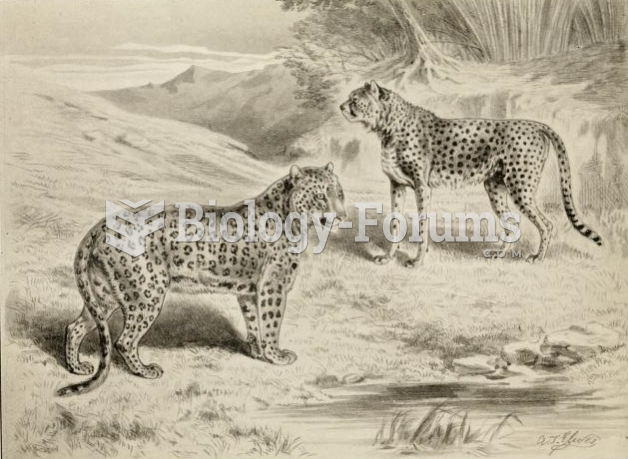 Comparative illustration of a leopard (left) and cheetah (right)
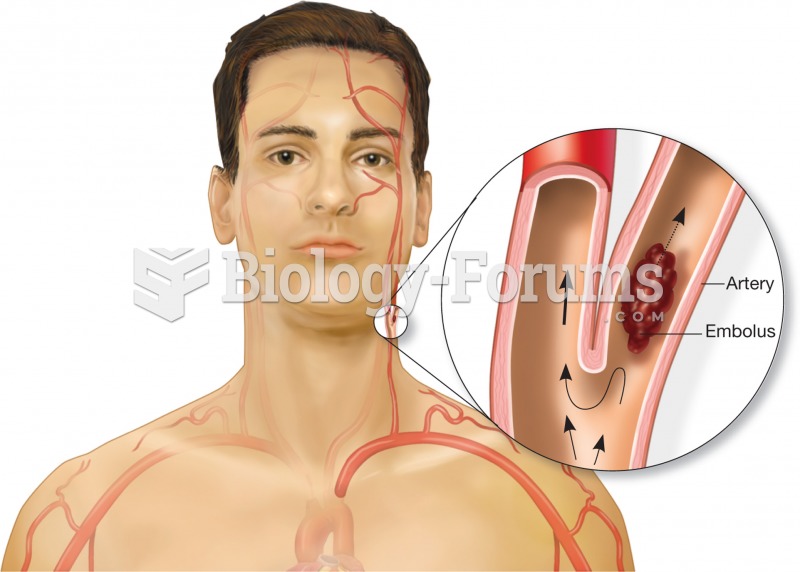 Illustration of an embolus floating in an artery. The embolus will become lodged in a blood vessel t
 The Pleiades, an open cluster of stars in the constellation of Taurus. These stars share a common mo
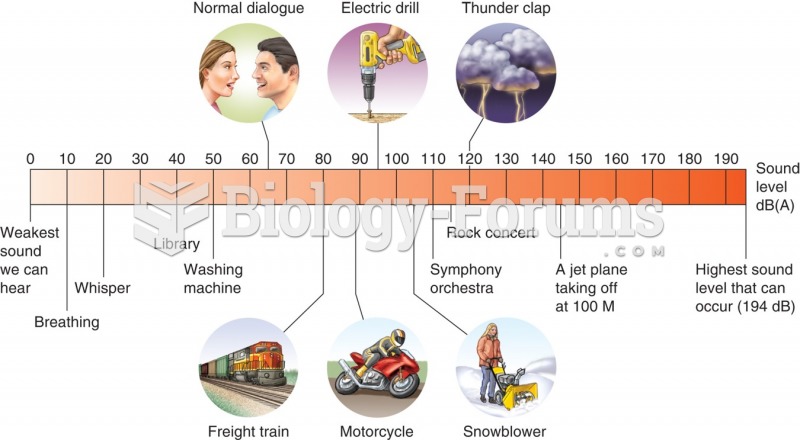 This illustration shows the decibel level in various locations and associated with different ...
 Stock Market Tracks Growth in GDP