This topic contains a solution. Click here to go to the answer
|
|
|

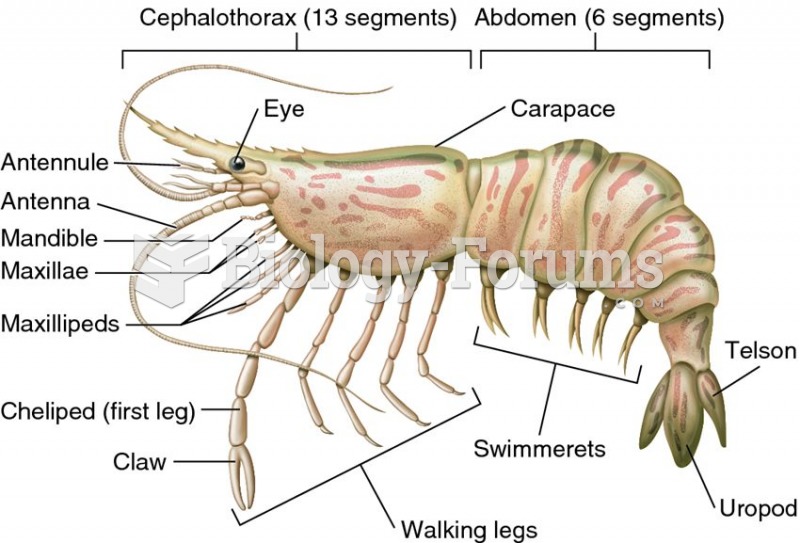 Body plan of a crustacean, as represented by a shrimp
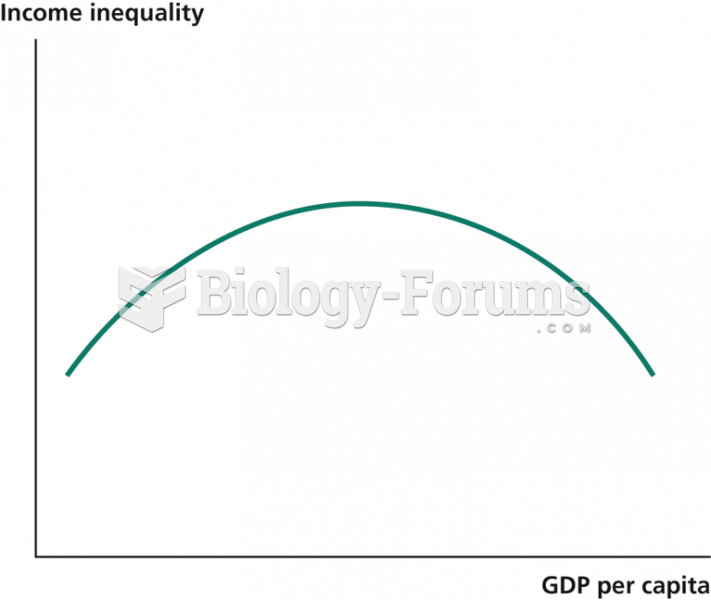 The Kuznets Curve
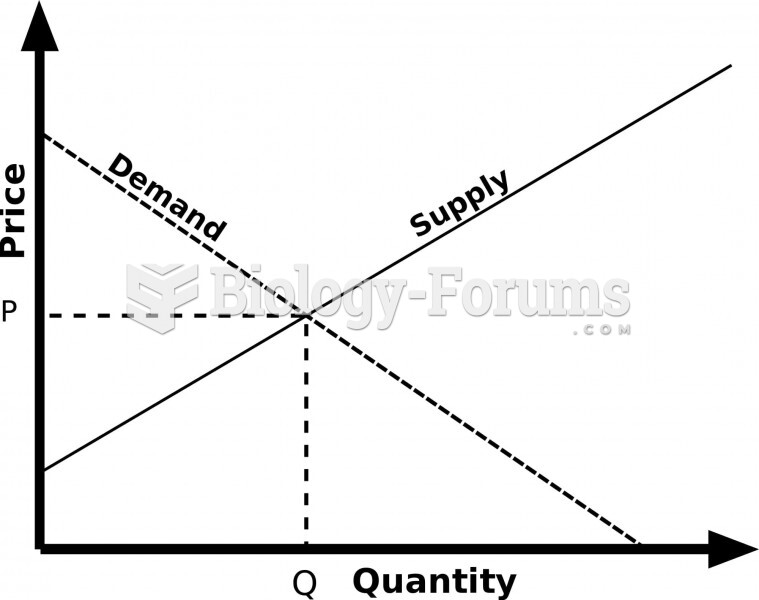 The original Supply and Demand graph
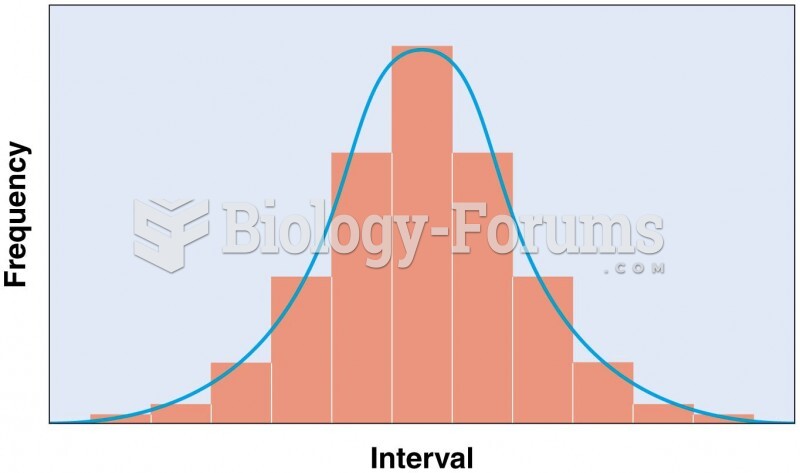 Normal frequency distribution, characterized by a bell-shaped curve
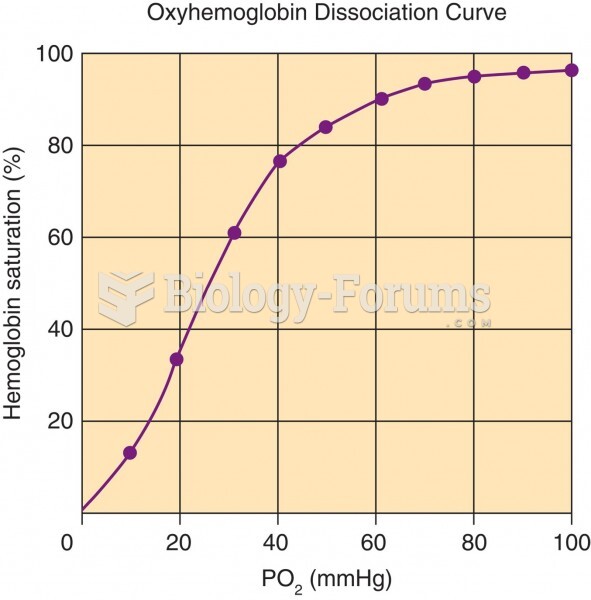 The Oxyhemoglobin Dissociation Curve
 Decrease in mean haplotype heterozygosity