This topic contains a solution. Click here to go to the answer
|
|
|

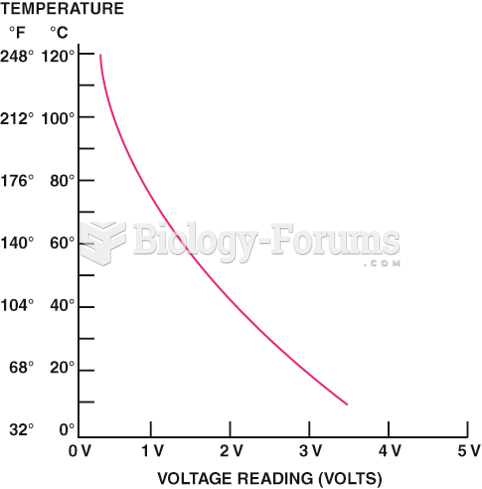 A typical ECT sensor temperature versus voltage curve.
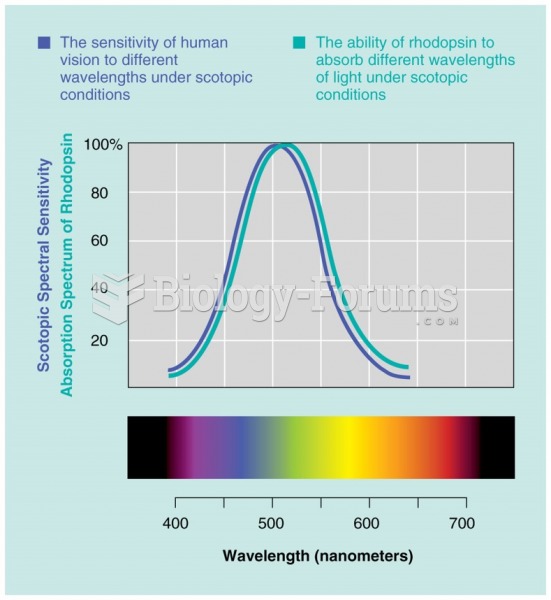 The adsorption spectrum of rhodopsin compared with the human scotopic spectral sensitivity curve.
 How to create a sine equation when the curve is given
 Shift to one side. Let the recipient’s arm hang down. Knead upper and lower arm muscles from ...
 Who's Policing the Food Supply?
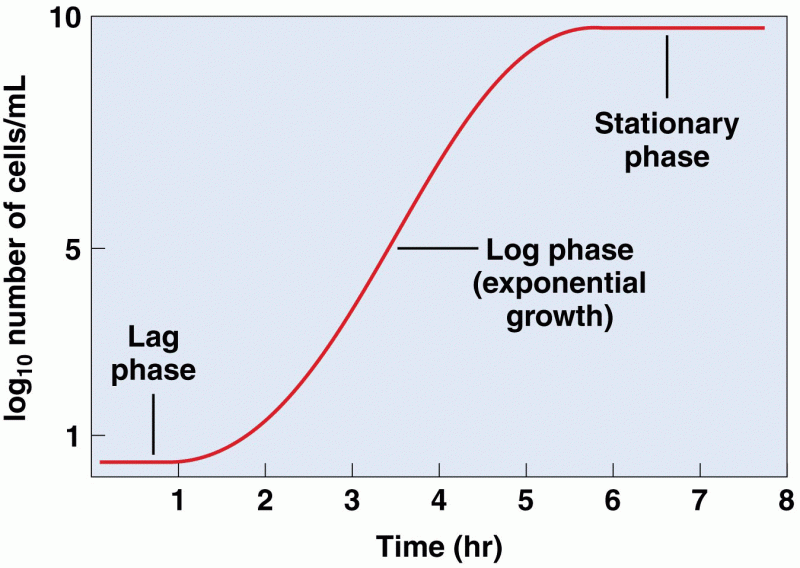 Typical bacterial population growth curve showing the initial lag phase