This topic contains a solution. Click here to go to the answer
|
|
|

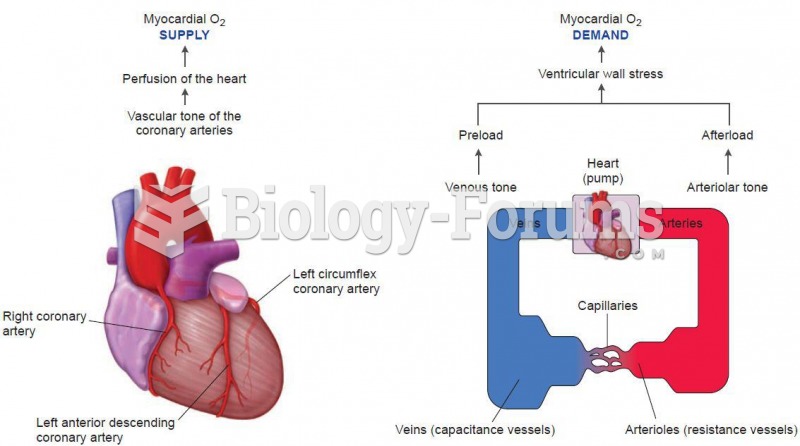 Myocardial Oxygen supply and demand
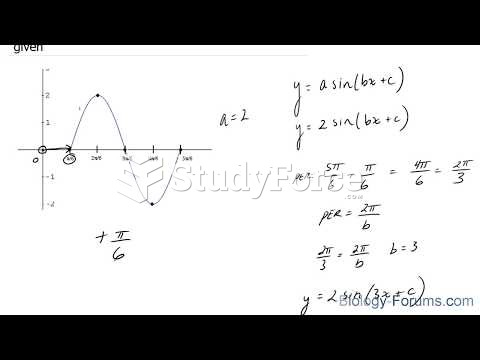 How to create a sine equation when the curve is given
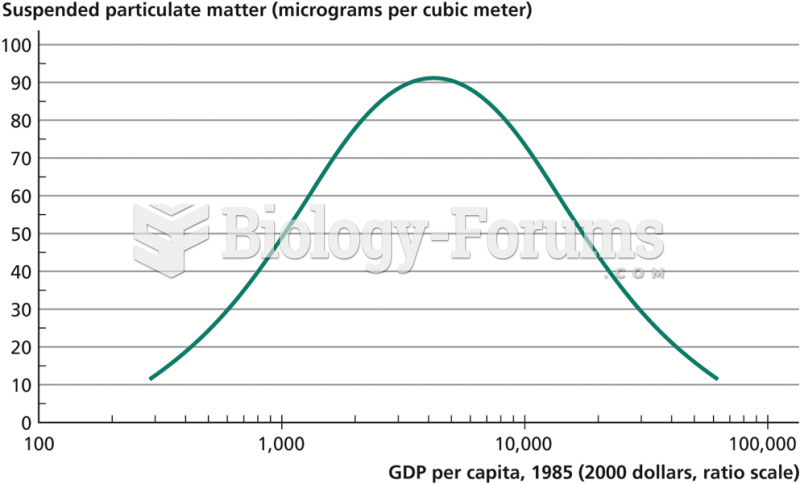 An Environmental Kuznets Curve
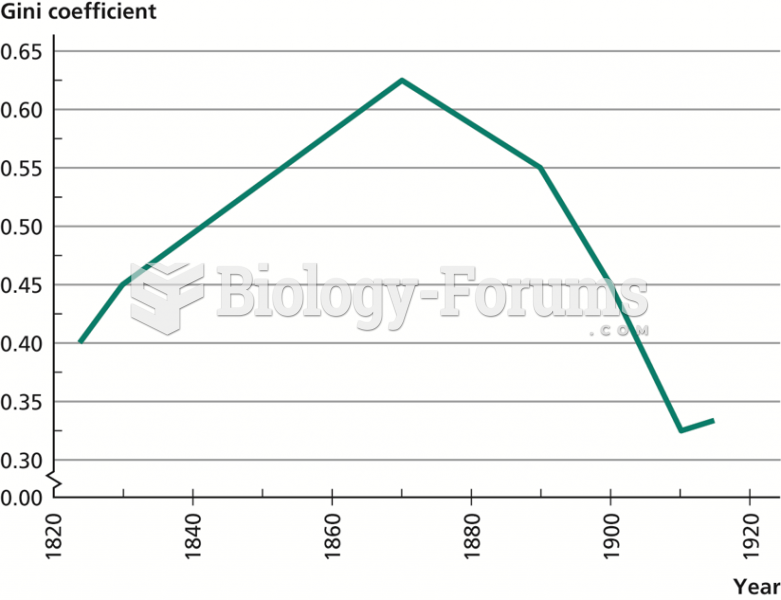 The Kuznets Curve in England and Wales, 1823–1915
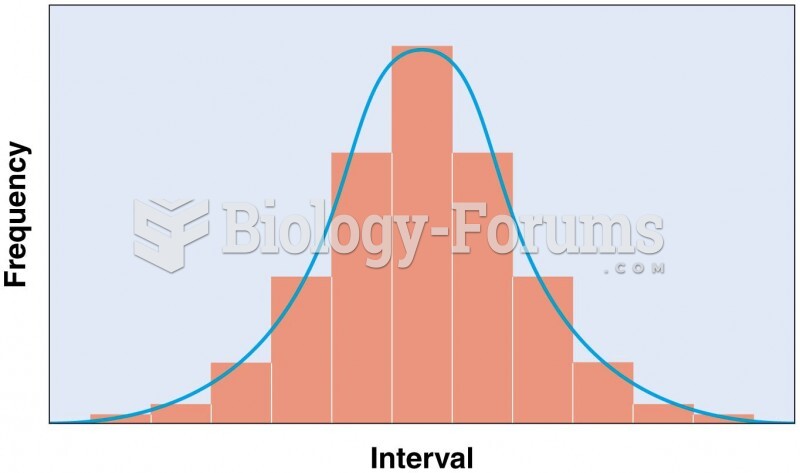 Normal frequency distribution, characterized by a bell-shaped curve
 Construct a Lorenz curve that shows income distribution in this society.