This topic contains a solution. Click here to go to the answer
|
|
|

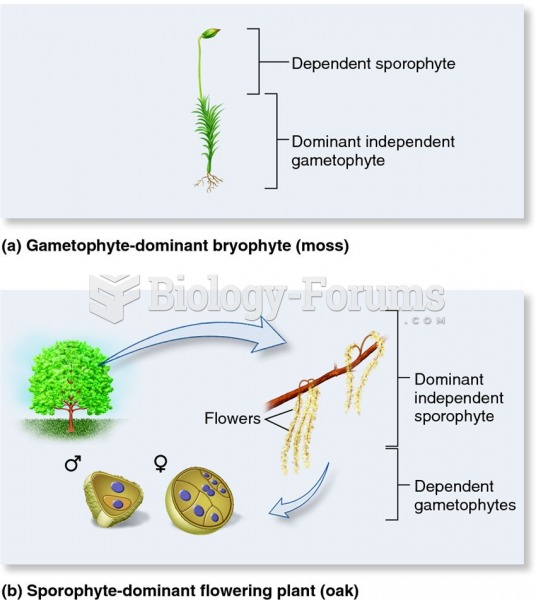 Evolutionary shift in plant life cycle stage dominance.
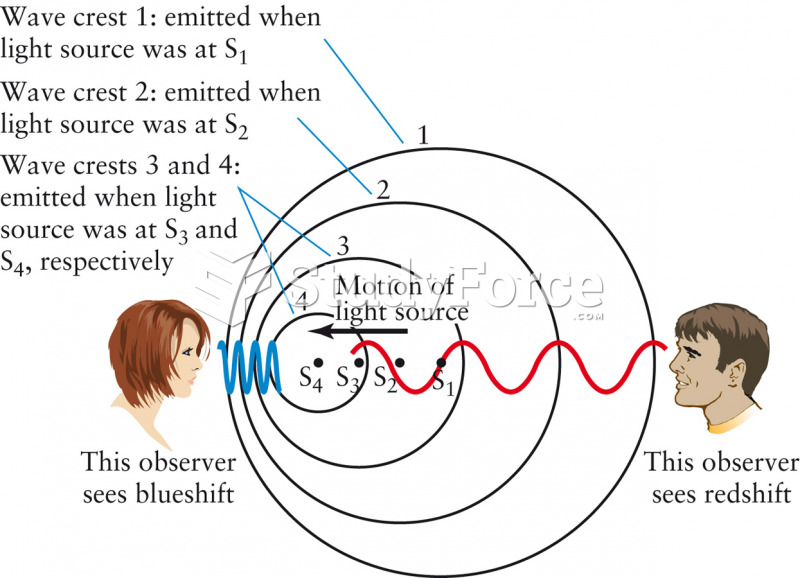 The Doppler Shift
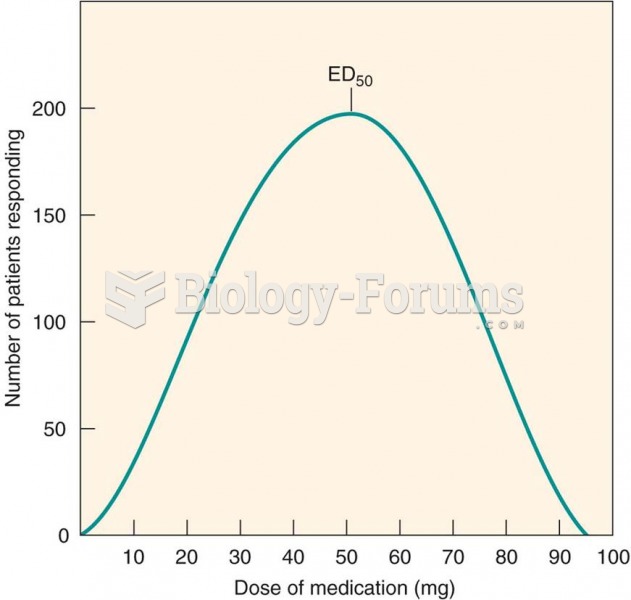 Frequency distribution curve: interpatient variability in drug response
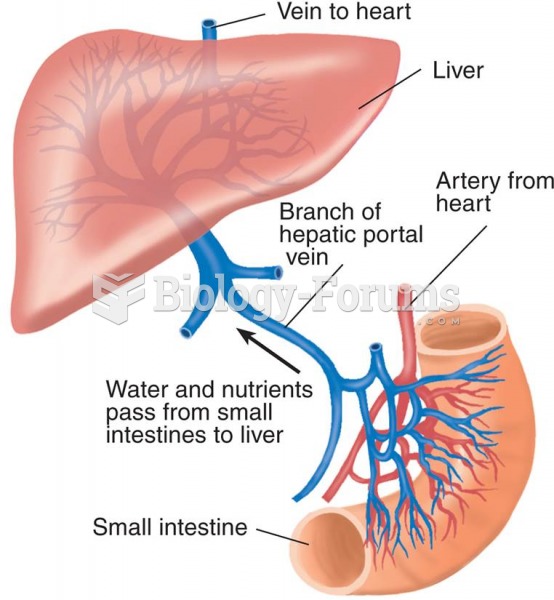 The Hepatic Portal Blood Supply The liver receives water, minerals, and nutrients from the digestive
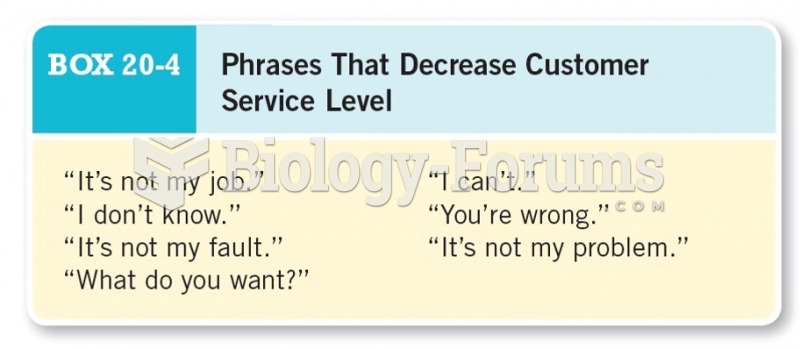 Phrases that Decrease Customer Service Level
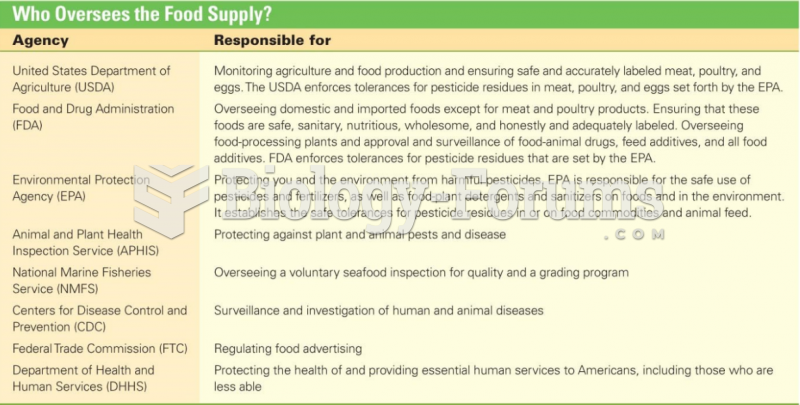 Who Oversees the Food Supply?