This topic contains a solution. Click here to go to the answer
|
|
|

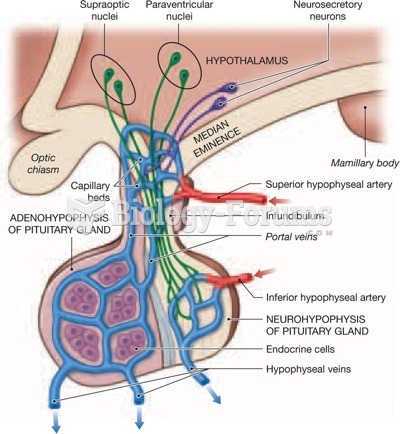 Blood supply to the pituitary gland
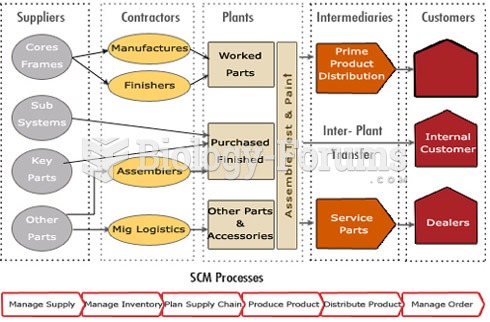 supply chain
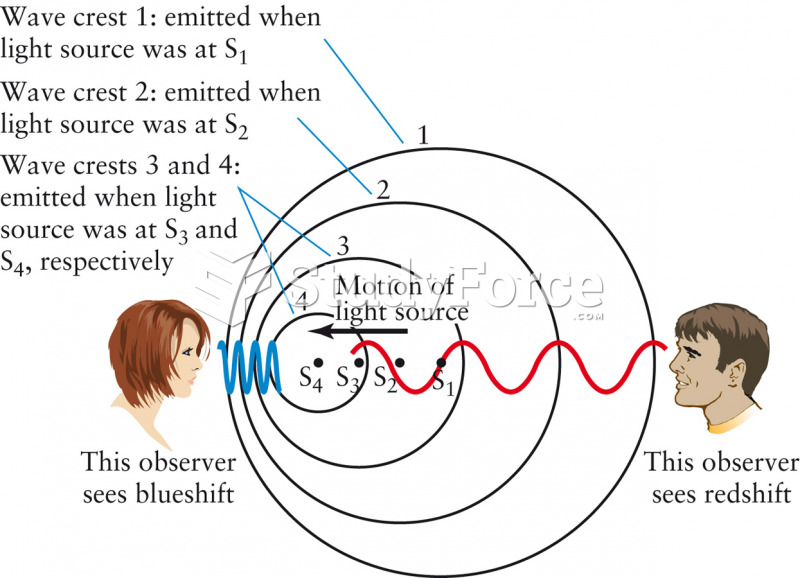 The Doppler Shift
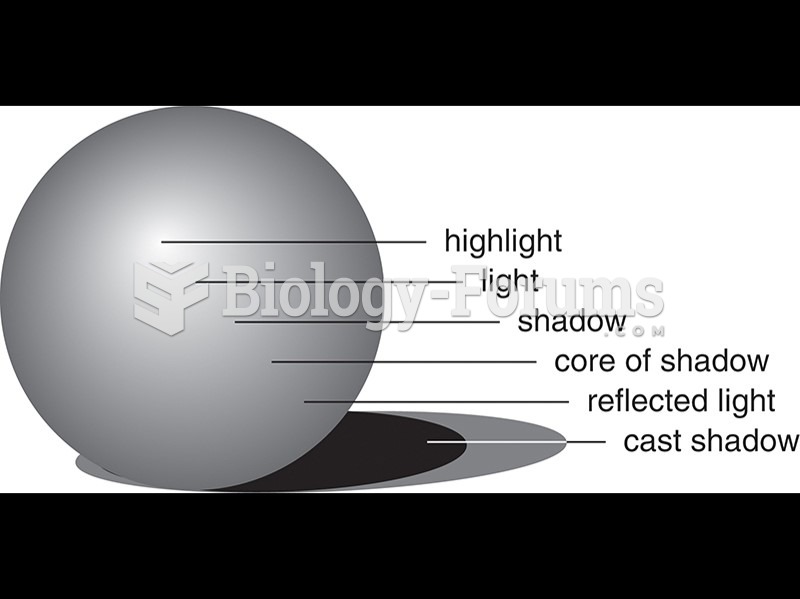 A sphere represented by means of modeling.
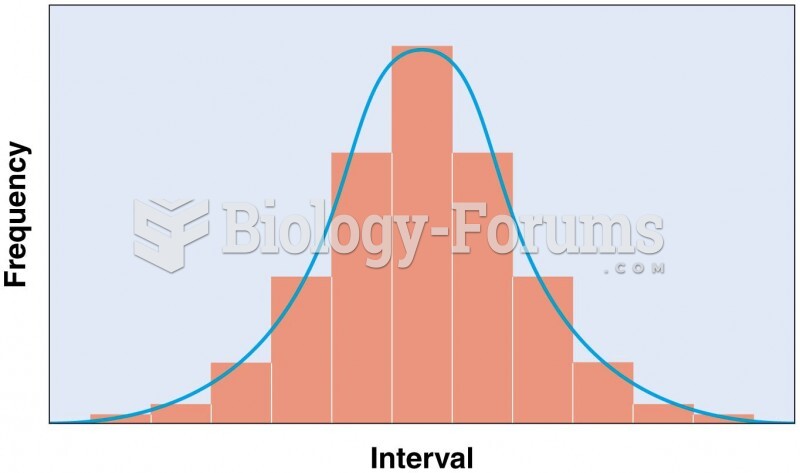 Normal frequency distribution, characterized by a bell-shaped curve
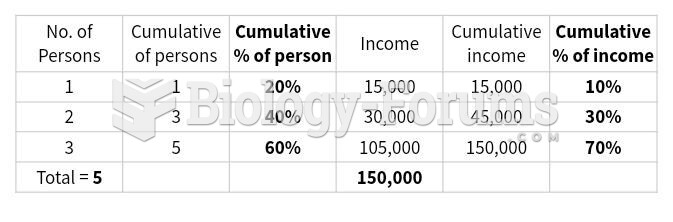 Construct a Lorenz curve that shows income distribution in this society.