|
|
|

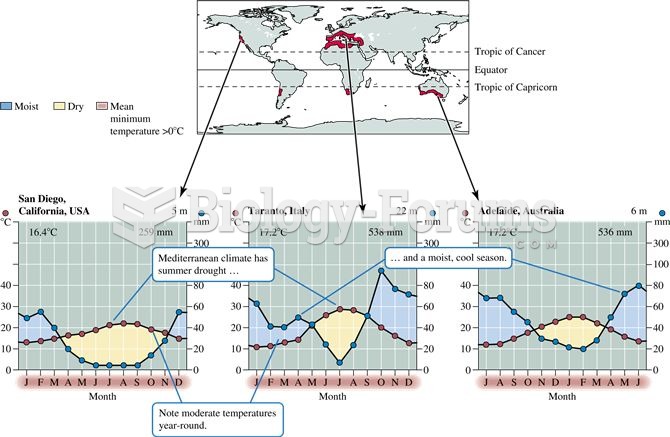 Mediterranean woodland and shrubland distribution and climate.
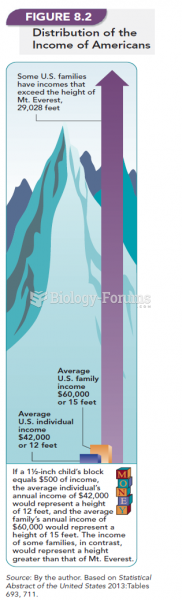 Distribution of the Income of Americans
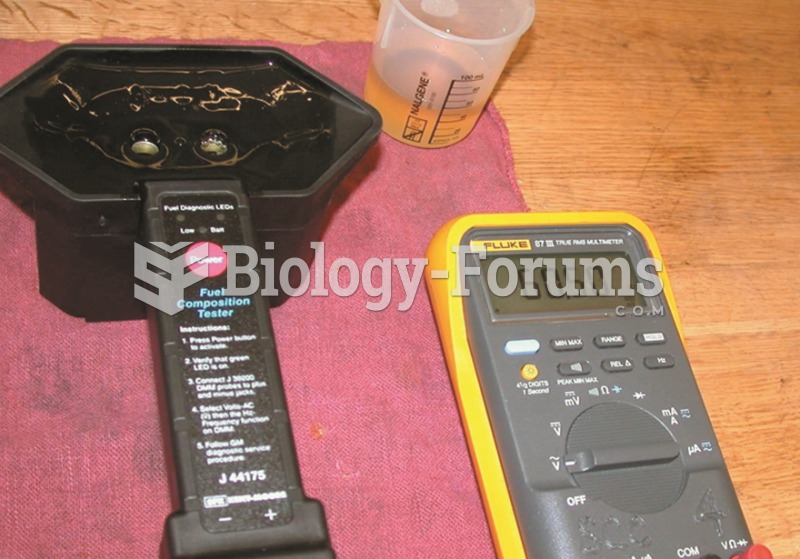 Record the AC frequency as shown on the meter and subtract 50 from the reading (e.g., 60.50 -50.00 = ...
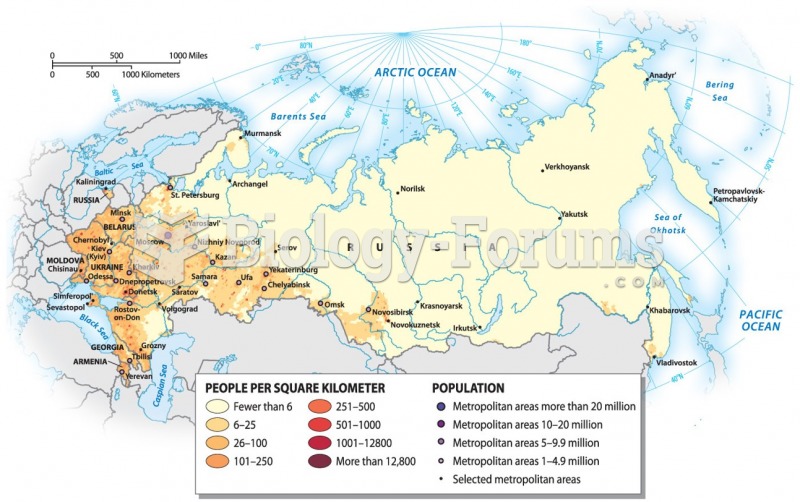 Population Distribution
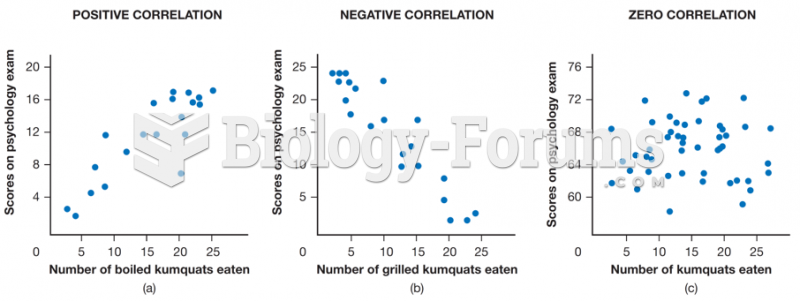 Correlations between scores on a psychology test and number of boiled kumquats eaten per month
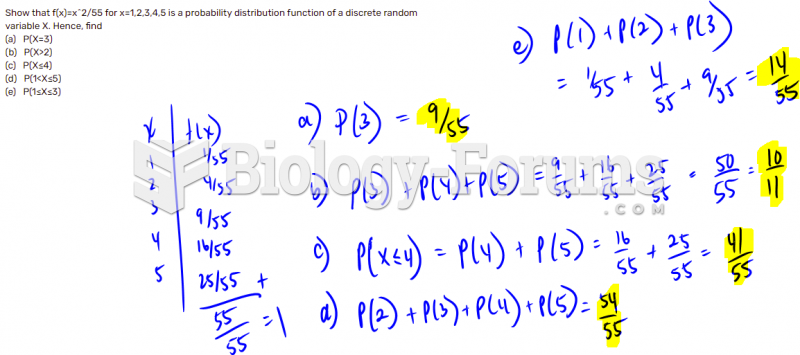 Discrete random variables- Probability Distribution Function