A graph that shows how the amount of advertising expenditure differs among various industries can be shown
A) by a trend-section graph.
B) by a scatter diagram.
C) by a time-series graph.
D) as a trend.
E) by a cross-section graph.
Question 2
The potential money multiplier gives us
A) the maximum potential change in the money supply due to a change in reserves.
B) the growth in real national income when the money supply increases.
C) the maximum potential change in the money supply due to a change in income.
D) the growth in the money supply when income increases.

 This Native American depiction of the Sand Creek Massacre, painted on a buffalo hide, shows the Indi
 How Orbital Eccentricity Changes the Amount of Solar Radiation Earth Receives
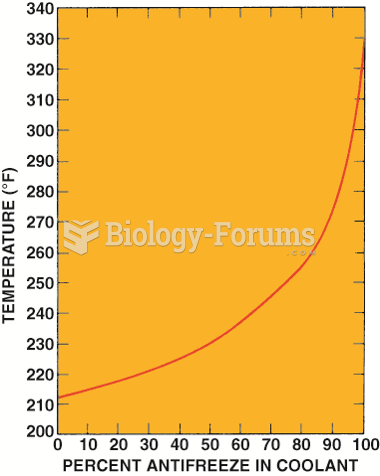 Graph showing how the boiling point of the coolant increases as the percentage of antifreeze in ...
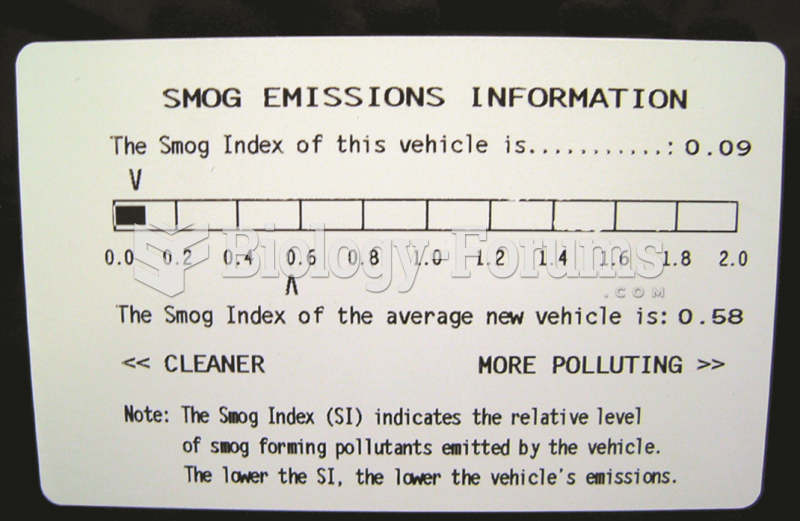 This label on a Toyota Camry hybrid shows the relative smog-producing emissions, but this does not ...
 Sketch a graph of the function h(x), by hand on the following interval:
 graph
graph