|
|
|

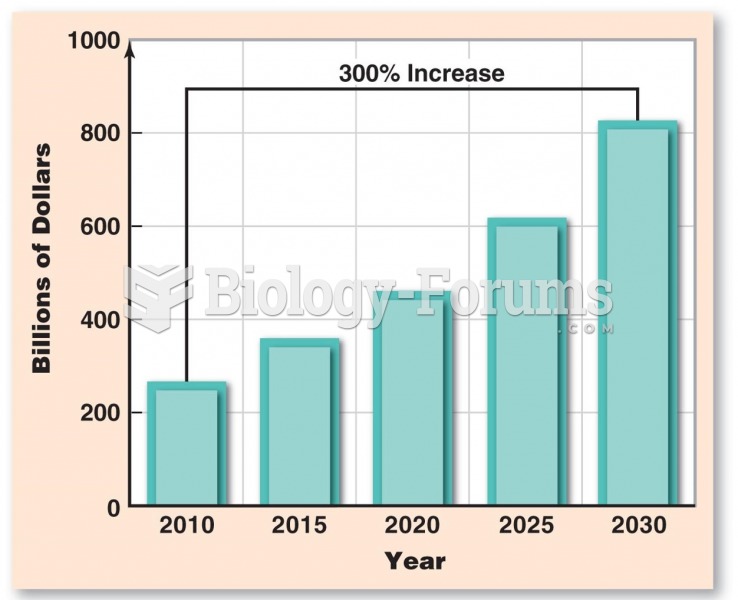 Economic Costs of CVD
 A typical distributor-type diesel injection pump showing the pump, lines, and fuel filter.
 7-month-old Leslie —an example of cross-modal transfer
 economic question
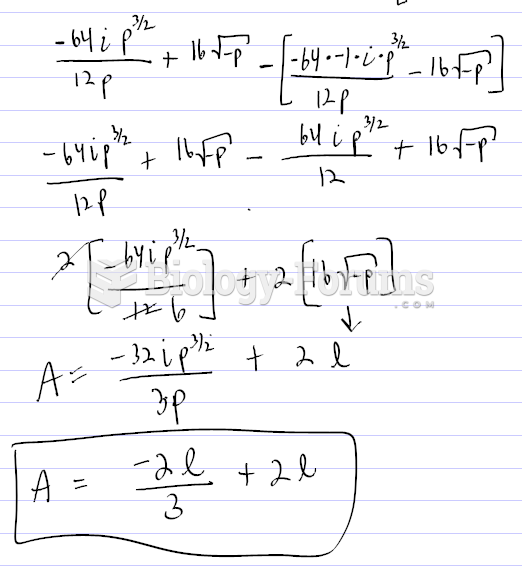 Finding the graph of a Parabola using certain values
 Morgan’s test-cross analysis of genetic linkage between autosomal genes