Author Question: Which type of economic graph reveals trends in data? A) time-series graph B) cross-section graph ... (Read 328 times)

lilldybug07

  • Hero Member
  • *****
  • Posts: 546
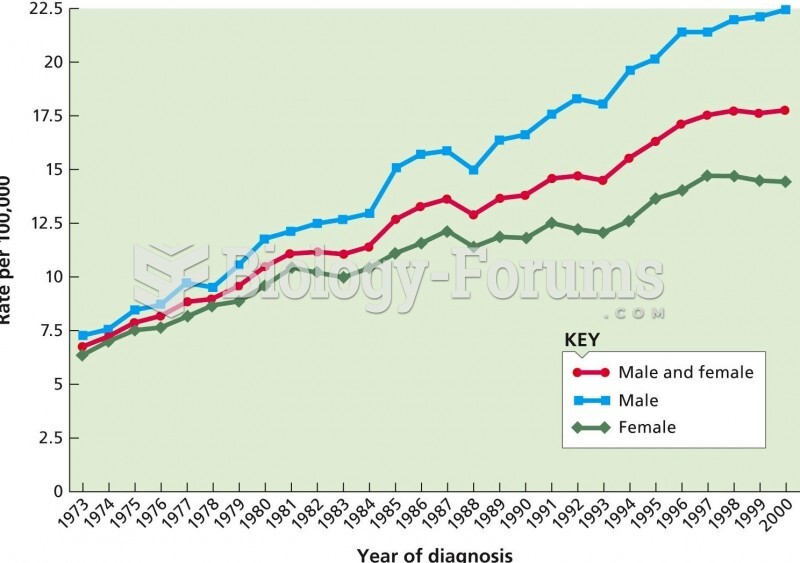
Which type of economic graph reveals trends in data?
 
  A) time-series graph
  B) cross-section graph
  C) scatter diagram
  D) Answers A and C are correct.
  E) Answers A, B, and C are all correct.

Question 2

The national debt is the total amount the ________ government has borrowed to make expenditures that ________ tax revenue.
 
  A) federal; exceed
  B) state and local; exceed
  C) state and local; are less than
  D) federal; are equal to
  E) federal; are less than


cegalasso

  • Sr. Member
  • ****
  • Posts: 295
Answer to Question 1

A

Answer to Question 2

A


Related Topics

Need homework help now?

Ask unlimited questions for free

Ask a Question


Did you know?

There are more nerve cells in one human brain than there are stars in the Milky Way.

Did you know?

Many people have small pouches in their colons that bulge outward through weak spots. Each pouch is called a diverticulum. About 10% of Americans older than age 40 years have diverticulosis, which, when the pouches become infected or inflamed, is called diverticulitis. The main cause of diverticular disease is a low-fiber diet.

Did you know?

Your heart beats over 36 million times a year.

Did you know?

A strange skin disease referred to as Morgellons has occurred in the southern United States and in California. Symptoms include slowly healing sores, joint pain, persistent fatigue, and a sensation of things crawling through the skin. Another symptom is strange-looking, threadlike extrusions coming out of the skin.

Did you know?

Approximately one in three babies in the United States is now delivered by cesarean section. The number of cesarean sections in the United States has risen 46% since 1996.

For a complete list of videos, visit our video library