|
|
|

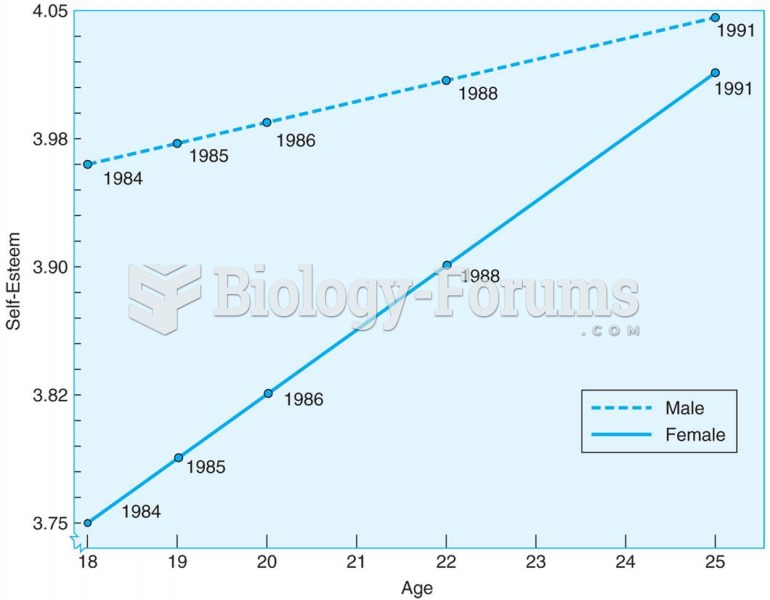 Young adults increase in self-esteem between the ages of 18 and 25, according to this longitudinal s
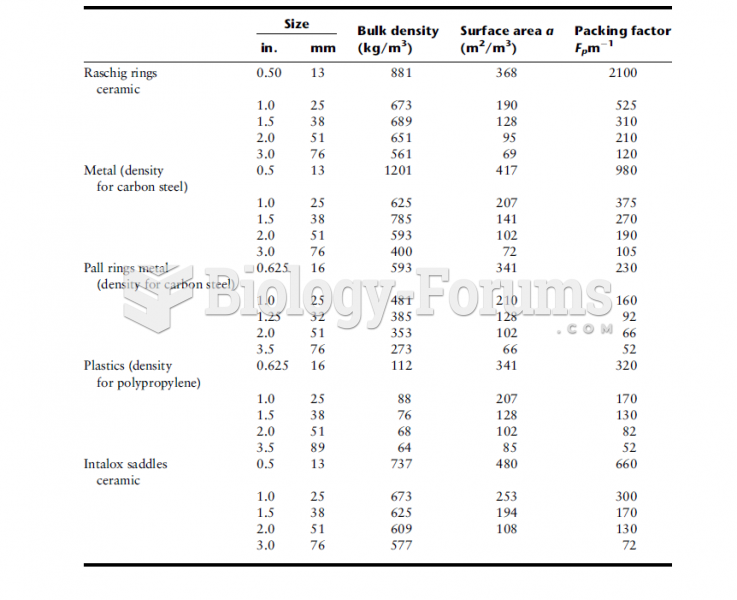 Design Data for Various Packings
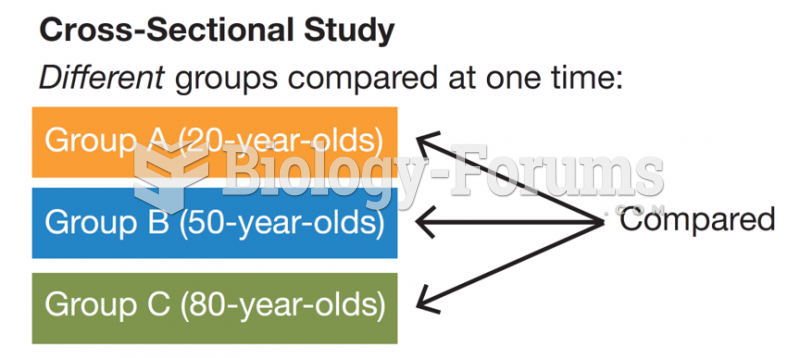 Cross-Sectional Studies
 economic question
 A three-point mapping cross in Drosophila melanogaster
 For each chromosome type in the body, there are two copies. One is from the mother, and one is from