|
|
|

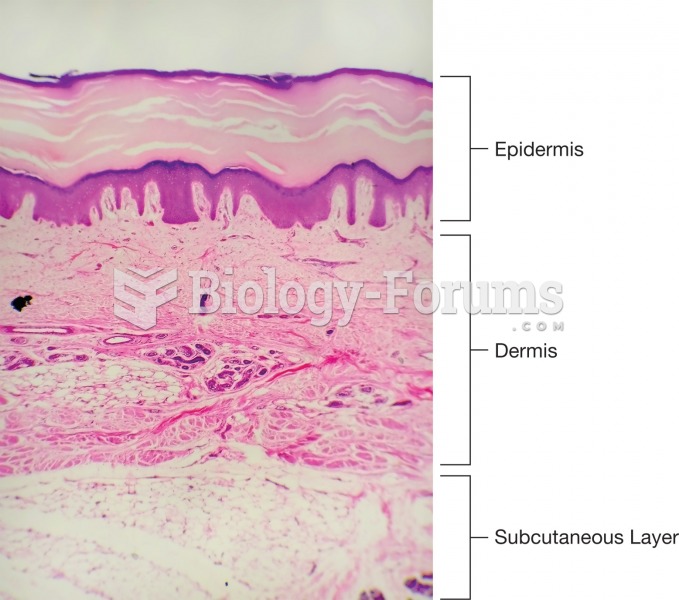 Photomicro graph showing the three layers of the skin.
 Map depicting the 2010 West Nile virus infections.
 How to graph line equations without a table of values
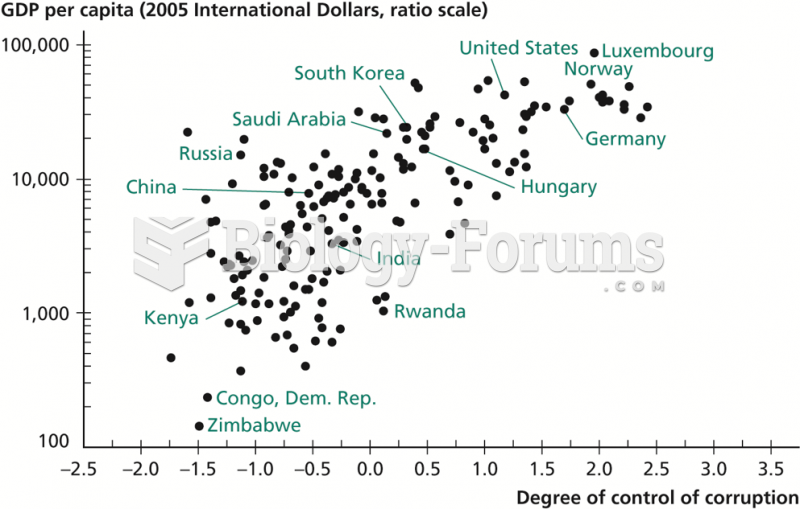 Government Corruption versus GDP per Capita, 2009
 graph
graph
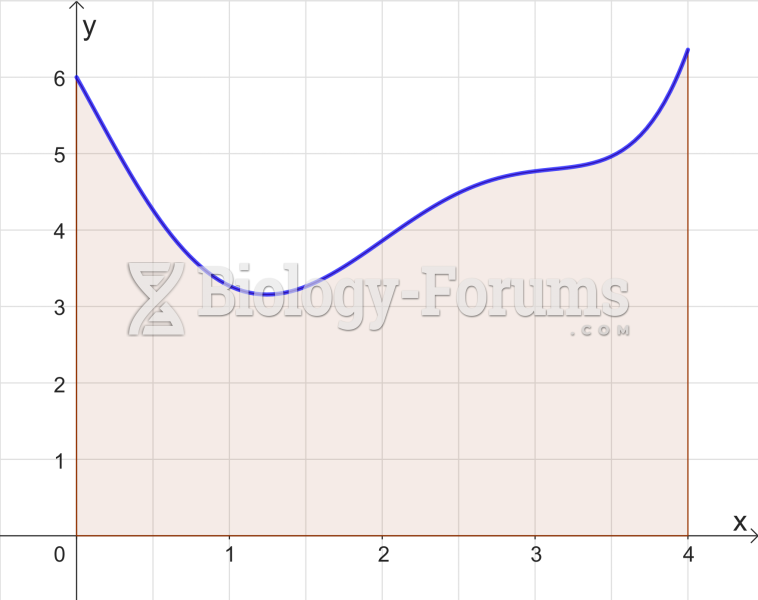 Trapezoidal Rule Graph