|
|
|

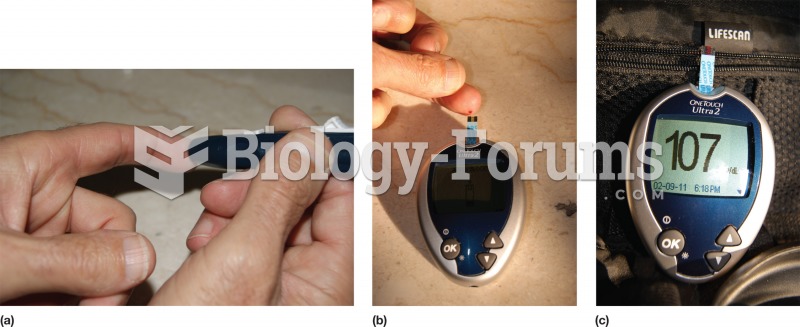 Blood glucose measurement. A postprandial test may be self-administered. (a) A lance pierces the ski
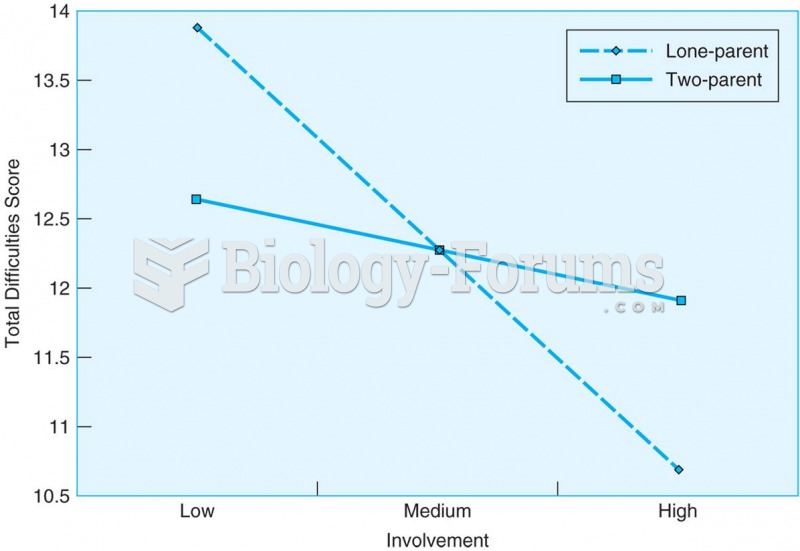 When teenagers live in single-parent homes, a good relationship with grandparents is related to ...
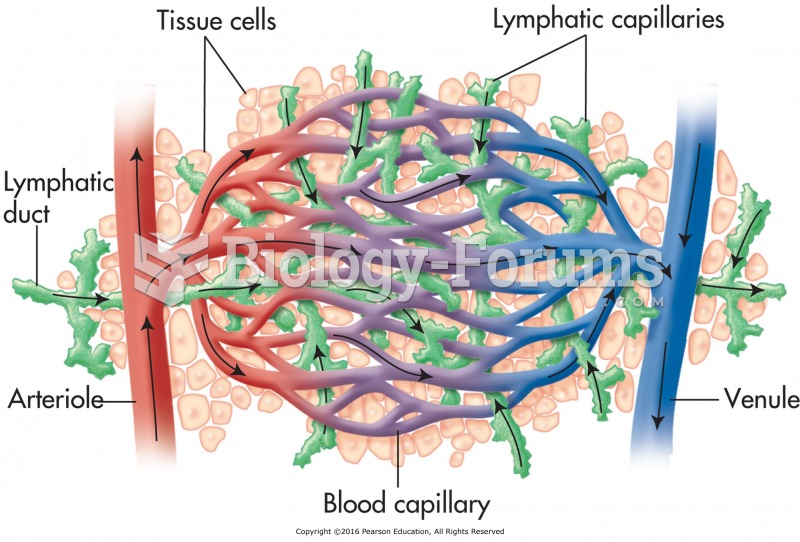 Relationship between blood and lymph capillaries.
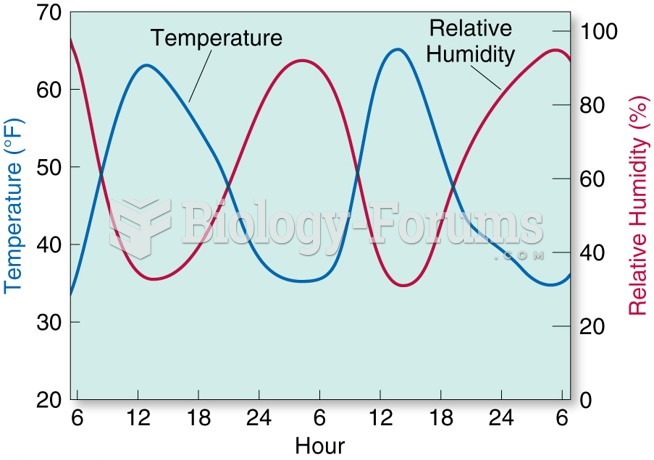 The relationship between RH and temperature.
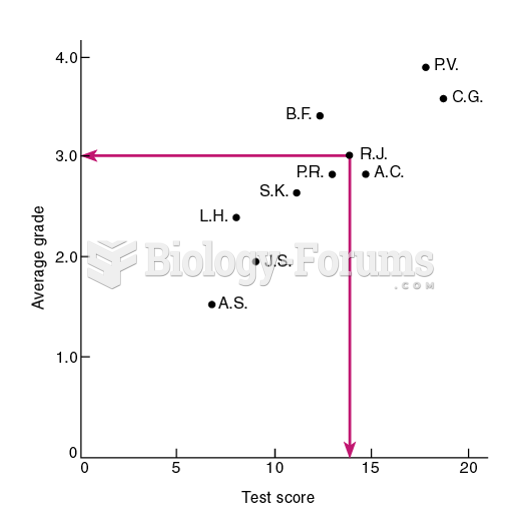 A Scatterplot of the Test Scores and Average Grades of 10 Students
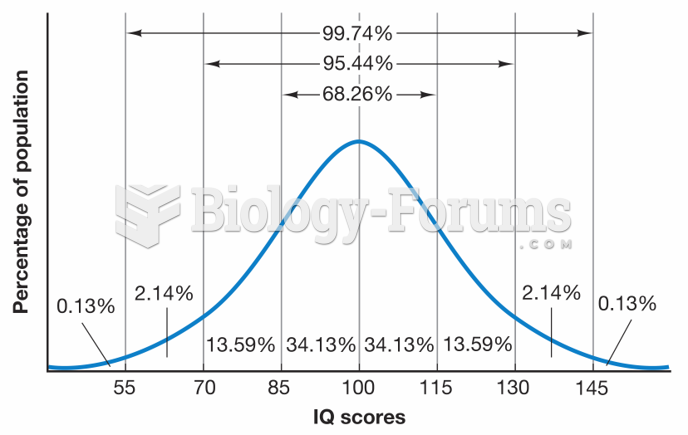 Expected Distribution of IQ Scores